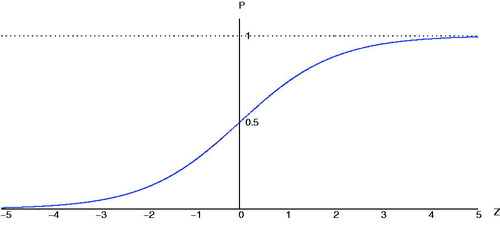
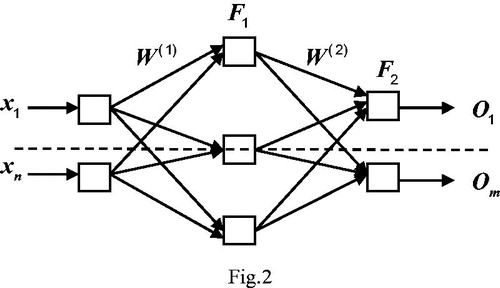
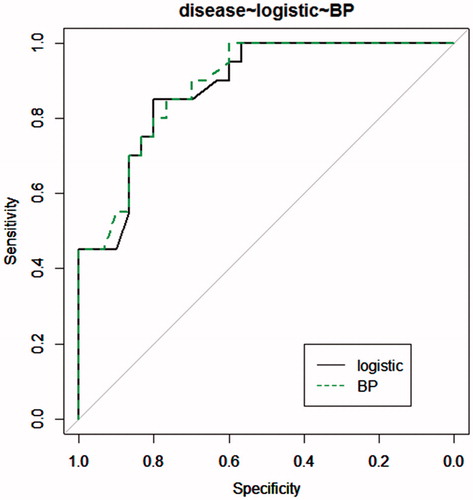
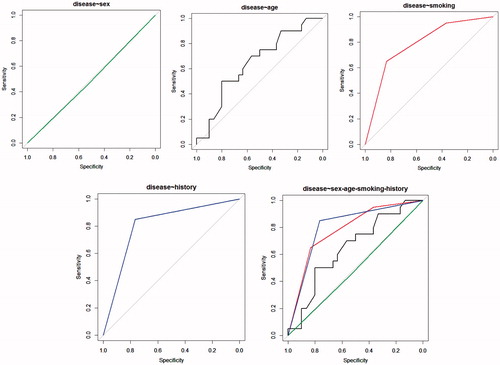
1,635
Views
0
CrossRef citations to date
0
Altmetric
Innovation in Biomedical Science and Engineering

Design and application of tumor prediction model based on statistical method*

, &

Figures & data

Figure 1. The logistic curves of Z and P.

Figure 1. The logistic curves of Z and P.

Figure 2. Model of two-layer BP network.

Figure 2. Model of two-layer BP network.

Figure 3. ROC curves of two prediction models.

Figure 3. ROC curves of two prediction models.

Figure 4. ROC curve analysis.

Figure 4. ROC curve analysis.