Figures & data
Figure 1. From EEG signal to microstates. (A) Original potential topography maps were extracted. (B) Original maps were analyzed by a cluster analysis to obtain four optimal classes of microstates. (C) Microstates sequences were obtained by fitting four classes microstates back to all data.
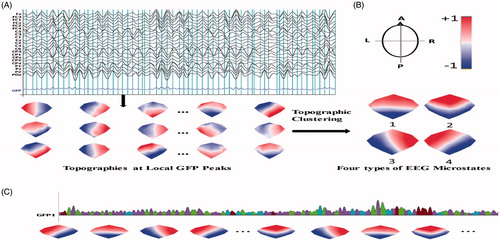
Table 1. Microstate parameters.
Table 2. Microstate classes transition probability[%].
Figure 2. Mean Duration of microstate class 3 and class 4 between left and right hand motor imagery. Gray line and triangle is the mean of each subject, dark line and diamond is the mean across all subjects.
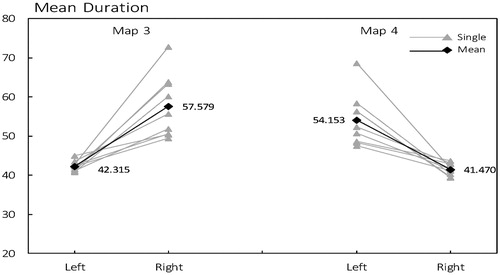
Figure 3. Occurrence of microstate class 3 and class 4 between left and right hand motor imagery. Gray line and triangle is the mean of each subject, dark line and diamond is the mean across all subjects.
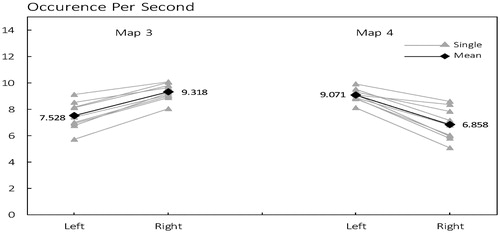
Figure 4. Time Coverage Ratio of microstate class 3 and class 4 between left and right hand motor imagery. Gray line and triangle is the mean of each subject, dark line and diamond is the mean across all subjects.
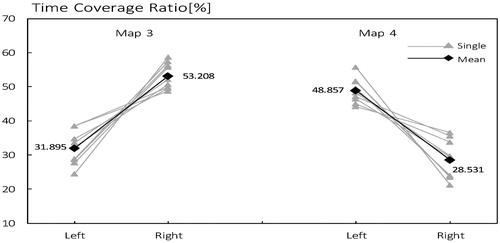
Figure 5. Transition probability from microstate class 1 to other states in left-hand motor imagery (L) compared to right-hand (R). Black column is the mean of each subject, red triangle is the average level across all subjects.
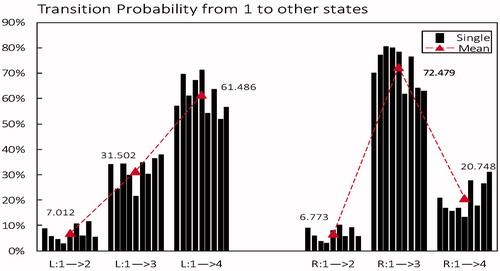
Figure 6. Transition probability from microstate class 2 to other states in left-hand motor imagery (L) compared to right-hand (R). Black column is the mean of each subject, red triangle is the average level across all subjects.
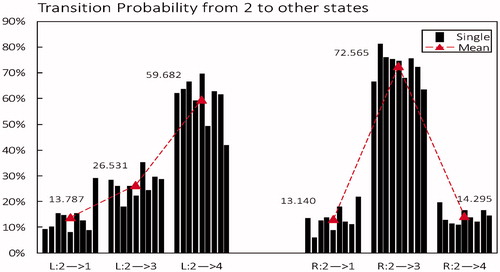
Figure 7. Transition probability from microstate class 3 to other states in left-hand imaging movent (L) compared to right-hand (R). Black column is the mean of each subject, red triangle is the average level across all subjects.
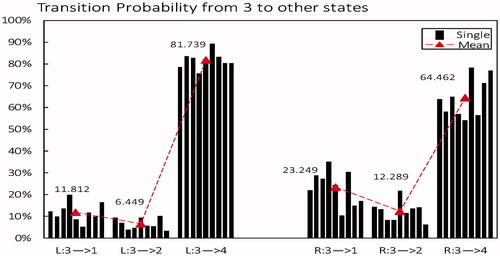
Figure 8. Transition probability from microstate class 4 to other states in left-hand motor imagery (L) compared to right-hand (R). Black column is the mean of each subject, red triangle is the average level across all subjects.
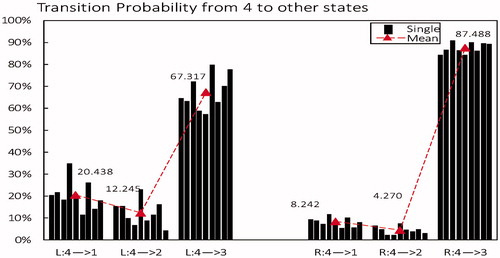
Table 3. Classification accuracy of different method and SD of 9 subjects.
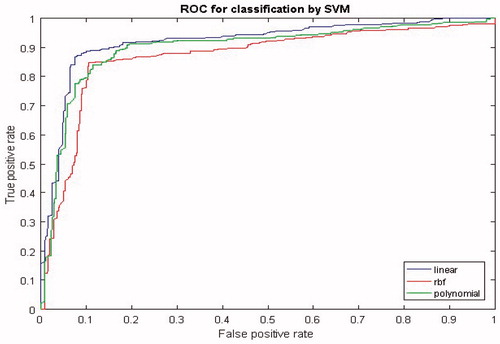
Figure 9. ROC curves of the SVM classifier with the linear, polynomial and RBF kernel functions.