
Figures & data
Figure 1. The abscissa of the graph is the training step of the network model, and the ordinate is the accuracy. There are two sets of data sets: the test set and the training set. It can be seen from the figure that the accuracy of the training set increases as the number of training steps increases; however, the test set is stopped at an early stage due to the small amount of data, and then the training is over, the accuracy of training is reduced.
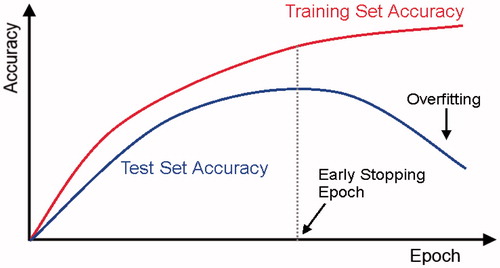
Figure 2. The graph shows the contrast of the three activation functions.
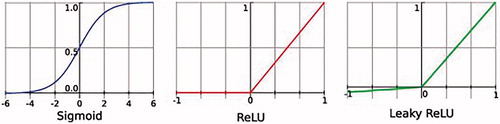
Figure 3. Use multi-layer filters for feature learning.
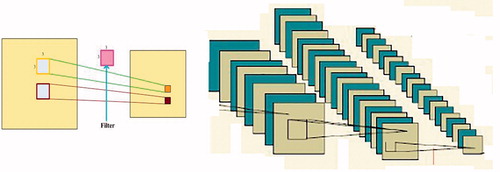
Figure 4. The ‘conv3*3’ in this diagram represents the convolution calculation using the 3*3 filter, and the ‘up’ indicates that the upper layer uses a 2*2 filter and the ‘drop’ represents the dropout layer.
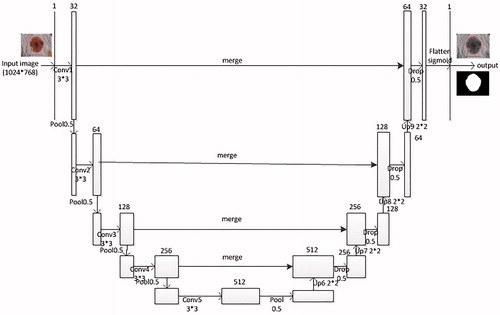
Table 1. The table is the architecture of the improved convolution neural network, including the names of the layers, the functions used and the corresponding parameters.
Table 2. The table is the structure of the function Inception and Nconvolution.
Figure 5. The figure is the result of the melanoma test set segmentation. The first picture is segmented by a clear red line, and the second is the binarized mask of the first graph.
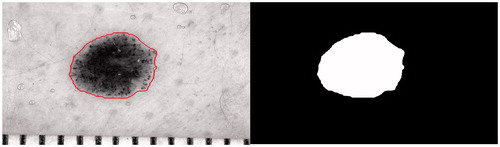
Figure 6. The graph contains 20 melanoma image segmentation results. The first and fourth rows are the result of the segmentation of the 20 melanoma images using the improved CNN, the lesion area is circled with the red line; the second and fifth rows are the mask of the test image segmentation; the third and sixth rows are Experts’ manual segmentation, ie ground truth mask. The results of the test segmentation are compared with the ground truth.
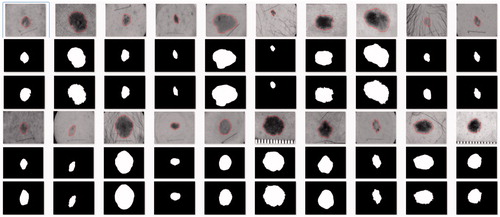
Figure 7. The figure is the indicator of the melanoma test segmentation (FP, TN, TP, FN), by comparing the test segmentation results with the expert segmentation results.
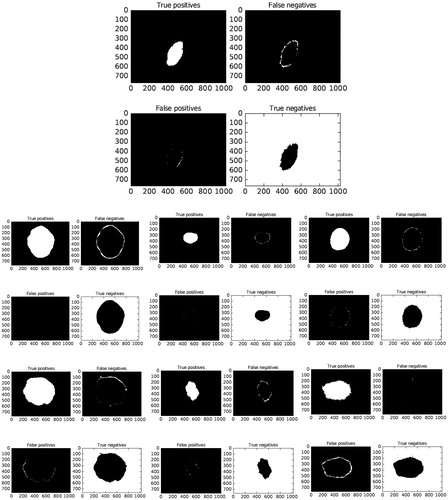
Table 3. The table is the indicators of the melanoma image test set segmentation results TPR, FPR, TNR, FNR, Precision, Recall, Ffactor, RandIndex, ARI, where the seven image indicators correspond to the above seven mask images.
Table 4. Lesion Segmentation Result. Higher results is better.