
Figures & data
Figure 1. An example of fluid-structural interaction analyzed at baseline. The three-dimensional lumenal surface of the right coronary artery is created using coronary CTA. Inlet velocity and outlet pressure are entered into the fluid-structure interaction model to calculate wall shear stress and von Mises stress values.
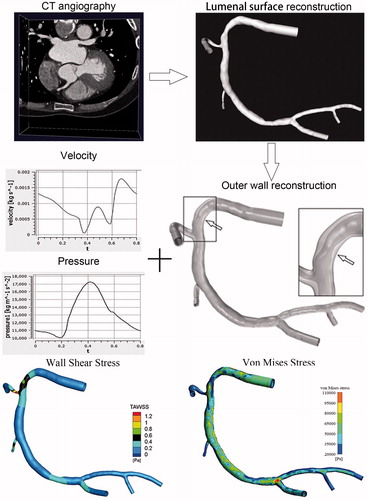
Table 1. Baseline demographics and clinical characteristics.
Figure 2. Effect of baseline WSS and VMS on vascular outcomes in coronary artery segments at follow-up. (A) WSS and change in minimal lumen area. (B) VMS and change in minimal lumen area. (C) WSS and change in plaque burden. (D) VMS and change in plaque burden. (E) WSS and change in plaque volume. (F) VMS and change in plaque volume. The p values refer to the univariate analysis and are adjusted for the clustering of segments within patients and for multiple comparisons. Error bars represent SEM. MLA = minimal luminal area; PB = plaque burden; PV = plaque volume; SEM = standard error of the mean; VMS = von Mises stress; WSS = wall shear stress.
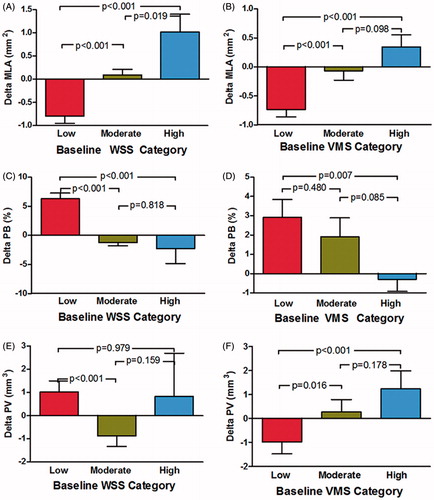
Table 2. Independent baseline predictors of the change in anatomic outcomes in 3-mm segments (n = 365).
Figure 3. (A) Frequency of serial remodeling patterns in low-, moderate-, and high-WSS segments. (B) Frequency of serial remodeling patterns in low-, moderate-, and high-VMS segments. The p values refer to the ordered logistic regression analysis and are adjusted for the clustering of segments within patients. The primary variable of interest (wall shear stress) is not removed, even if not significant, from the backward stepwise process of logistic regression analysis. CI = confidence interval.
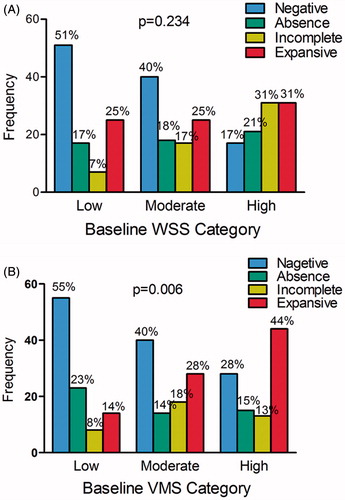
Table 3. Independent baseline predictors of arterial remodeling in 3-mm segments (n = 365).