Figures & data
Figure 1. In vivo T2-MR images C6 tumor-bearing mice at designated time points after administration with (a) FA-targeted nanospheres, (b) non-FA-targeted nanospheres, and (c) FA-inhibited nanospheres. The tumor sites were highlighted with red circles.
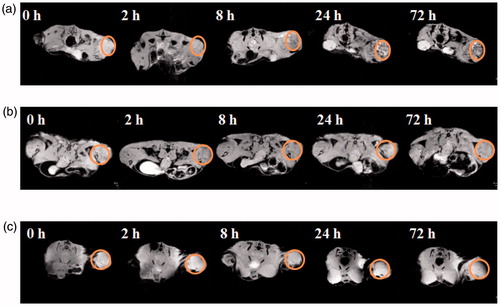
Figure 2. T2 relaxation time of the tumor regions in the groups treated with FA-targeted, non-FA-targeted, and FA-inhibited nanospheres at the specified time points. All values are presented as a mean ± SD (n = 3), *: P < 0.05.
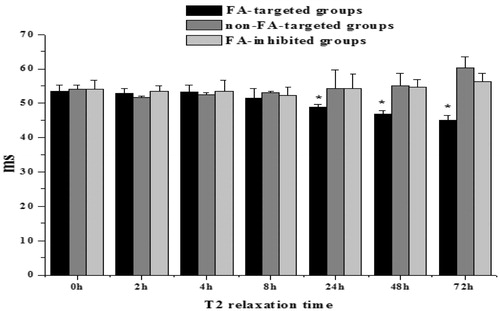
Figure 3. Prussian blue staining results of the tumor tissues in the groups intervened with FA-MAN (a), MAN (b) and FA-MAN + FA (c) at 72 h post-injection (×400 magnification) (the arrows show the Prussian blue-stained iron nanoparticles).
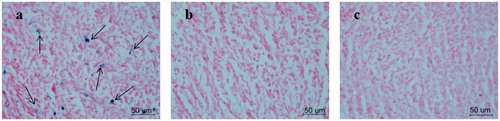
Figure 4. Changes in body weight of mice as a function of one month after intravenous injection of FA-MAN/MAN.
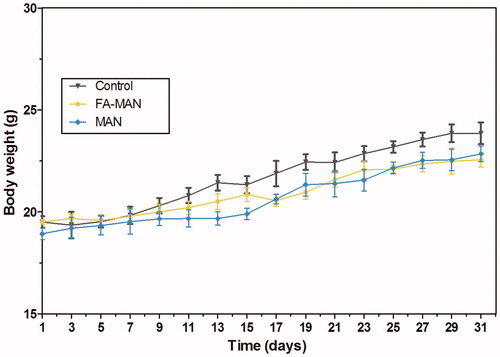
Figure 5. In vivo toxicology and serum sample biochemcal examination data acquired from BALB/c mice after 30 days post-injection intravenously with 150 µL physiological saline of FA-MAN/MAN nanospheres (10 mg Fe/ml): Blood routine test contained white blood cells (WBC), red blood cells (RBC) and hemoglobin (HGB); hepatic function biomarkers included alanine aminotransferase (ALT), aspartate aminotransferase (AST), and alkaline phosphatase (ALP); renal function parameters included blood urea nitrogen (BUN) and creatinine (CREA). Untreated healthy mice were used as the negative control. Five mice were included in each group.
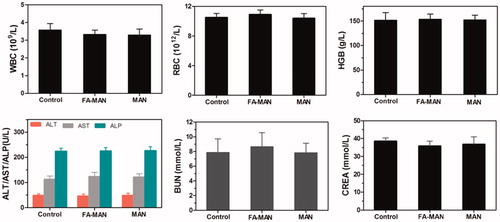
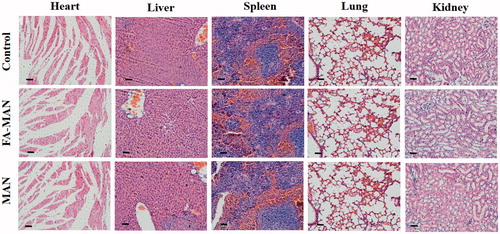
Figure 6. H&E staining iamges of the major organs (heart, liver, spleen, lung, kidney) from different groups. Mice were intravenously injected with 150 µL physiological saline of FA-MAN/MAN nanospheres (10 mg Fe/ml) and dissected after 30 days of post-injection (Scale bar: 50 µm).