1,231
Views
0
CrossRef citations to date
0
Altmetric
Innovation in Biomedical Science and Engineering

Optimal distance of multi-plane sensor in three-dimensional electrical impedance tomography

, , &

Figures & data

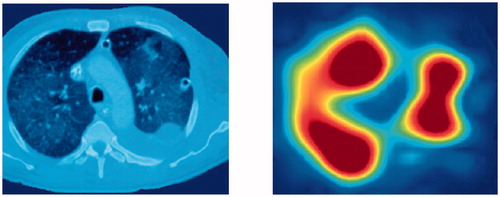
Figure 1. CT scan (left) and functional EIT image (right) from a patient.

Figure 1. CT scan (left) and functional EIT image (right) from a patient.

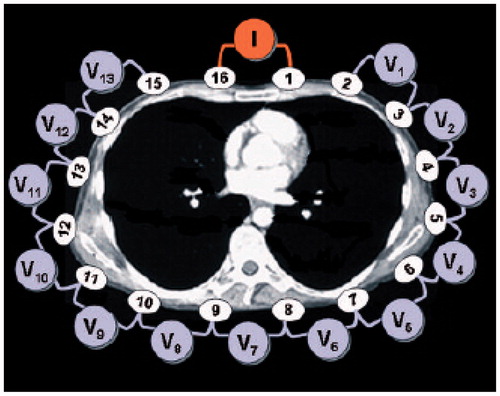
Figure 2. Monitoring the changes of thoracic impedance.

Figure 2. Monitoring the changes of thoracic impedance.

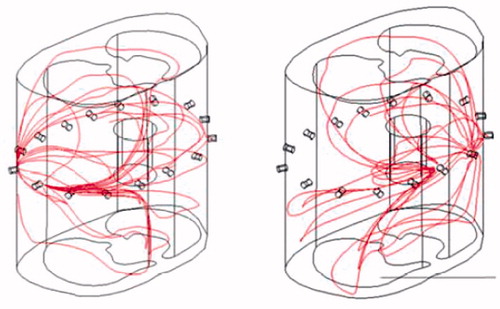
Figure 3. Current density distributions in 3 D condition.

Figure 3. Current density distributions in 3 D condition.

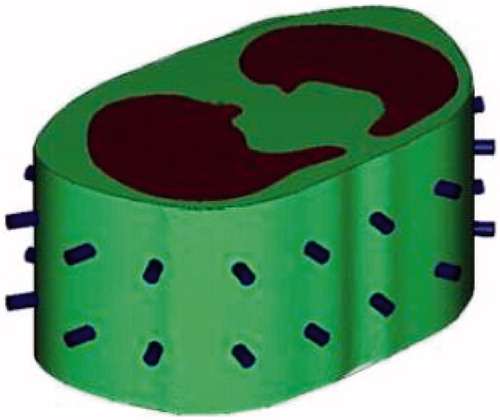
Figure 4. Two-plane sensor array in 3 D model.

Figure 4. Two-plane sensor array in 3 D model.

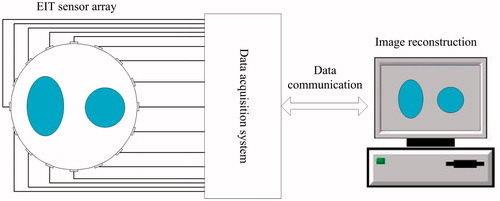
Figure 5. EIT system with 16-electrode sensor.

Figure 5. EIT system with 16-electrode sensor.

Figure 6. 2 D and 3 D EIT sensor models. (a) 2 D EIT sensor model (b) 3 D single-plane EIT (c) 3 D two-plane EIT sensor model sensor model.

Figure 6. 2 D and 3 D EIT sensor models. (a) 2 D EIT sensor model (b) 3 D single-plane EIT (c) 3 D two-plane EIT sensor model sensor model.

Figure 7. Cross-section view with object distribution. (a) One rod at centre (b) One rod at midway (c) One rod at edge (d) Two rods (e) Three rods.
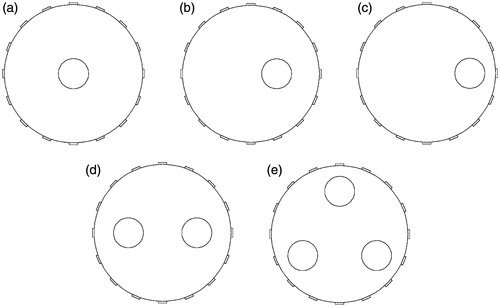
Figure 7. Cross-section view with object distribution. (a) One rod at centre (b) One rod at midway (c) One rod at edge (d) Two rods (e) Three rods.

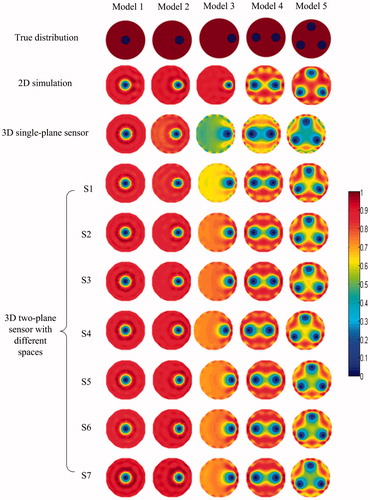
Figure 8. The simulation results of image reconstruction for five models.

Figure 8. The simulation results of image reconstruction for five models.

Figure 9. The correlation coefficient of the five models with different spacings for the 3 D two-plane EIT sensor.
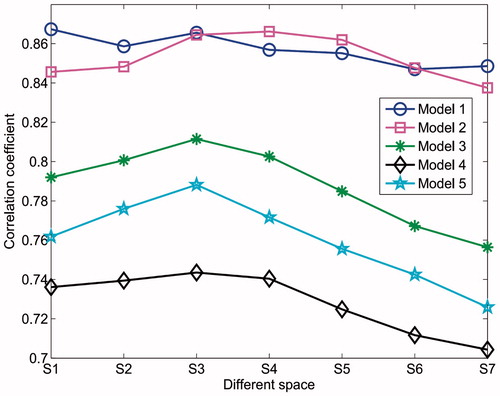
Figure 9. The correlation coefficient of the five models with different spacings for the 3 D two-plane EIT sensor.

Figure 10. The relative error of the five models with different spacings for the 3 D two-plane EIT sensor.
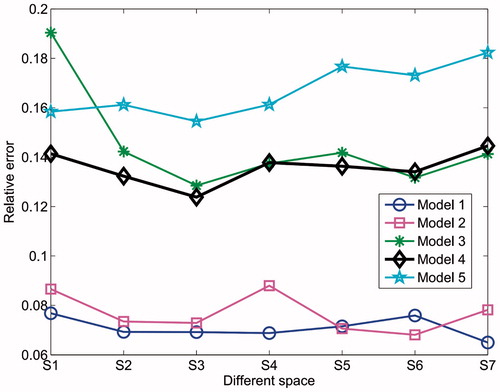
Figure 10. The relative error of the five models with different spacings for the 3 D two-plane EIT sensor.

Table 1. The correlation coefficient of the five models in simulation.

Table 2. The relative error of the five models in simulation.

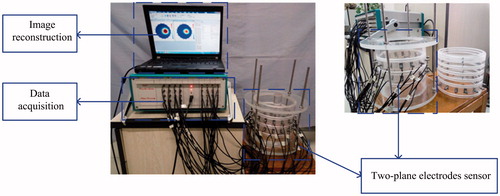
Figure 11. Experimental setup.

Figure 11. Experimental setup.

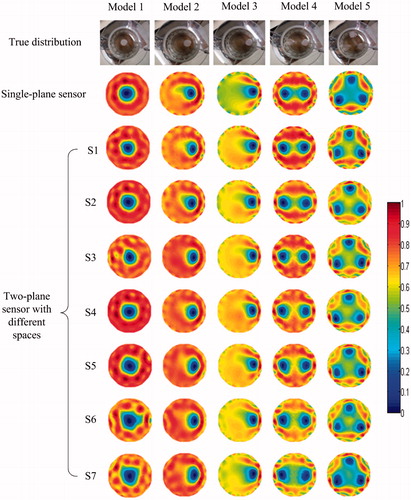
Figure 12. The experimental results of image reconstruction for five models.

Figure 12. The experimental results of image reconstruction for five models.

Figure 13. The correlation coefficient of the five models with different spacings for the two-plane EIT sensor.
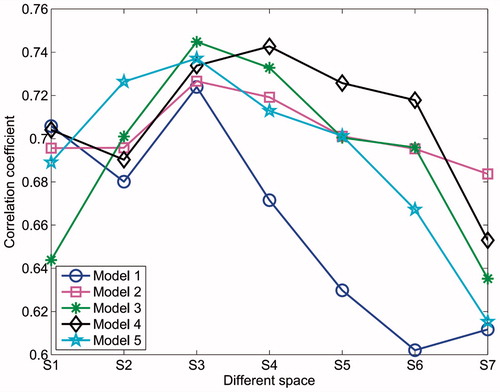
Figure 13. The correlation coefficient of the five models with different spacings for the two-plane EIT sensor.

Figure 14. The relative error of the five models with different spacings for the two-plane EIT sensor.
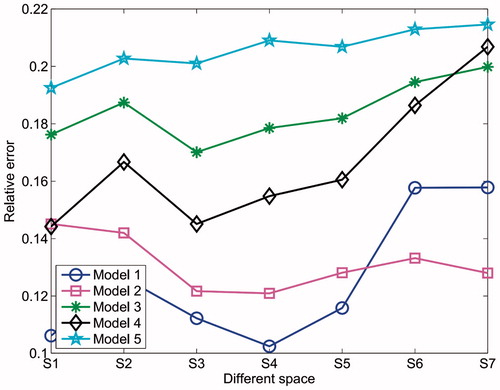
Figure 14. The relative error of the five models with different spacings for the two-plane EIT sensor.

Table 3. The correlation coefficient of the five models in real experiment.

Table 4. The relative error of the five models in real experiment.