
Figures & data
Table 1. Patient baseline characteristics.
Figure 1. a typical case of PELD. Notes: (A) coronal CT shows L5/S1 right FLDH. (B) sagittal MRI shows L5/S1 FLDH. (C) and (D) intraoperative channel X-ray images. (E) and(F)Exposure of exiting nerve root.
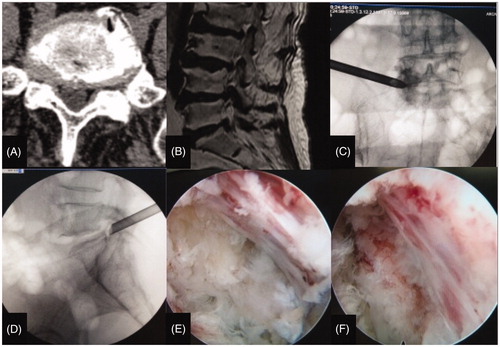
Figure 2. A typical case of MIS-TLIF CTS. Notes: (A) CT shows L4/5 left FLDH. (B) sagittal MRI shows L4/5 FLDH. (C) and (D) X-ray images demonstrate permanent position after 1 year.(E) and (F) coronal CT images after 1 year.
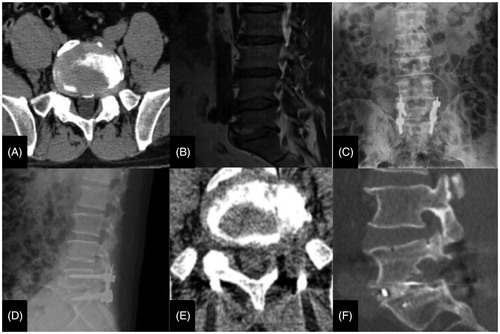
Figure 3. A typical case of MIS-TLIF BPS. Notes: (A) coronal CT shows L5/S1 right FLDH. (B) sagittal MRI shows L5/S1 FLDH. (C) and (D) X-ray images demonstrate permanent position after 1 year.(E)coronal and(F)sagittal CT images after 1 year.
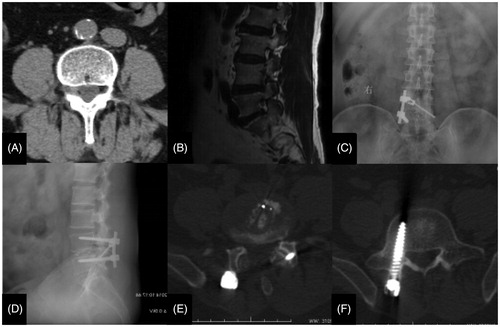
Table 2. Surgical outcomes.
Table 3. Pre- and postoperative LP VAS score, ODI score and Macnab criteria assessment.