
Figures & data
Figure 1. Diagram of five-layer head tissue model and NIRS probe configuration.
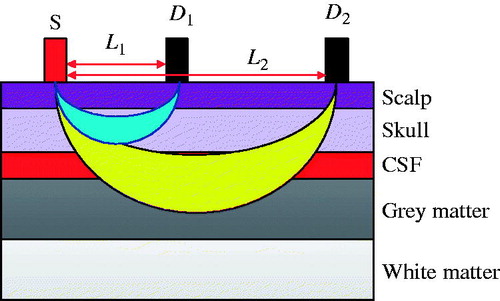
Figure 2. Ideal task-related haemodynamic changes in the Grey matter.
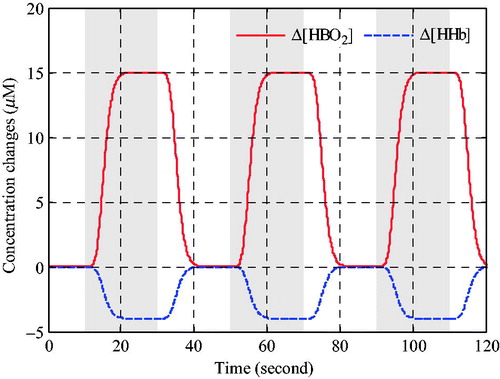
Figure 3. Simulated signals for optical density changes for long source-detector distance. (a) Optical density changes for 750 nm. (b) Optical density changes for 830 nm.
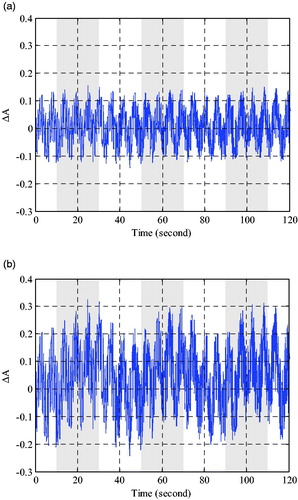
Figure 4. The time series signal of Δ[HbO2] calculated based on MLBL. (a) The results for long source-detector distance. (b) The results for short source-detector distance.
![Figure 4. The time series signal of Δ[HbO2] calculated based on MLBL. (a) The results for long source-detector distance. (b) The results for short source-detector distance.](/cms/asset/35e7966c-3642-478e-b709-2b20f1d9f771/icsu_a_1557901_f0004_c.jpg)
Figure 5. The time series signal of Δ[HHb] calculated based on MLBL. (a) The results for long source-detector distance. (b) The results for short source-detector distance.
![Figure 5. The time series signal of Δ[HHb] calculated based on MLBL. (a) The results for long source-detector distance. (b) The results for short source-detector distance.](/cms/asset/cc207131-3e3e-48ac-865c-55bb6bad2bfc/icsu_a_1557901_f0005_c.jpg)
Figure 6. Performance comparison of oxyhemoglobin concentration changes estimation in Grey matter. (a) Evoked haemodynamic changes calculated by RLS algorithm. (b) Evoked haemodynamic changes calculated by proposed algorithm.
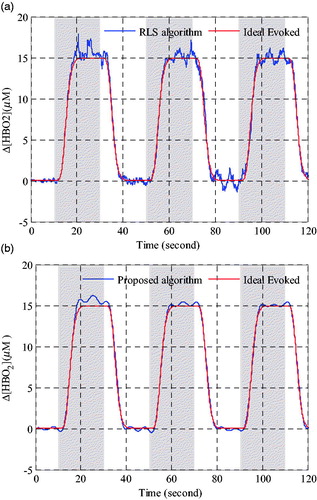
Figure 7. Performance comparison of deoxyhemoglobin concentration changes estimation in Grey matter. (a) Evoked haemodynamic changes calculated by RLS algorithm. (b) Evoked haemodynamic changes calculated by proposed algorithm.
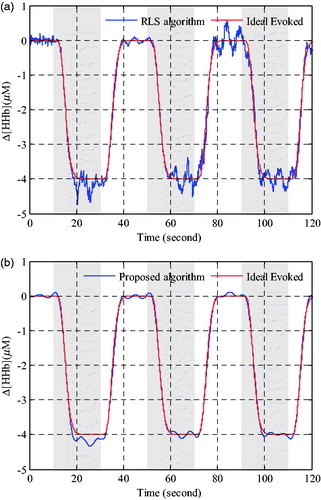
Table 1. Estimation accuracy of different methods for the haemodynamic concentration changes.