Figures & data
Figure 1. Changes of gray surfaces during fractal calculation, (a) δ = 1, (b) δ = 1/2, (c) δ = 1/4, (d) δ = 1/8.
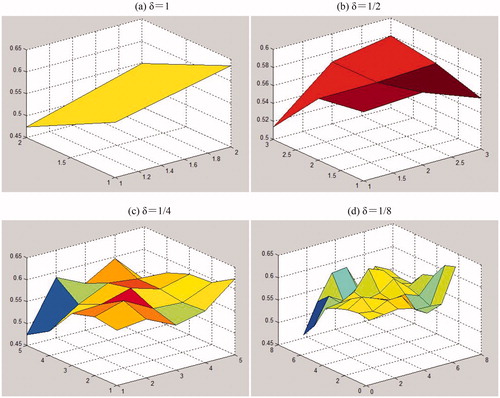
Figure 2. Distribution conditions of fractal dimensions of tongue coating texture in 499 normal tongue pictures and 88 thick/greasy tongue pictures.
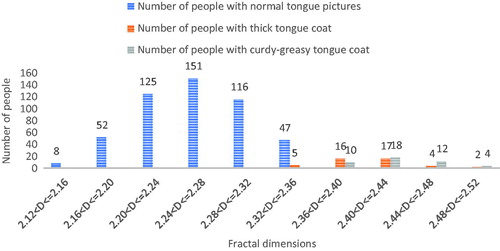
Figure 3. Testing results of characteristic parameters of multiple fractal spectrums of digitized tongue pictures.
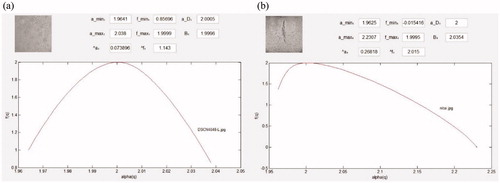
Figure 4. Statistics of comparison results between normal tongue pictures and greasy characteristic parameter spectrums.
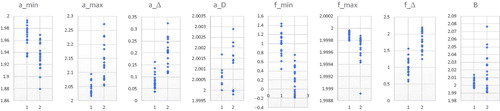
Figure 5. Statistics of comparison results of characteristic parameter spectrums between thin and thick tongue coating.
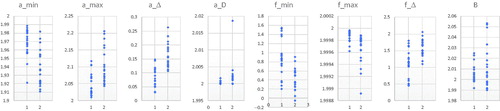
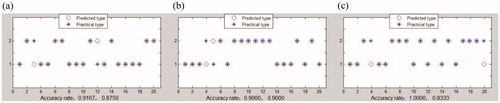
Figure 6. Statistics of accuracy rates of classifiers in identifying greasy characteristics of tongue coating based on multiple fractal spectrums.
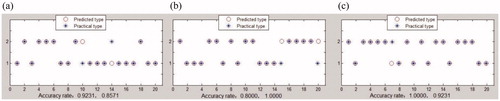
Figure 7. Statistics of accuracy rates of classifiers in identifying thin/thick characteristics of tongue coating based on multiple fractal spectrums.