Figures & data
Figure 1. Schematic diagram of wavelet denoising algorithm.
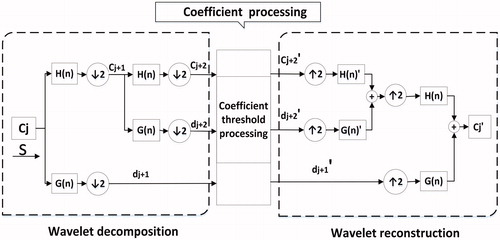
Figure 2. AFR of different frequency aliasing types.
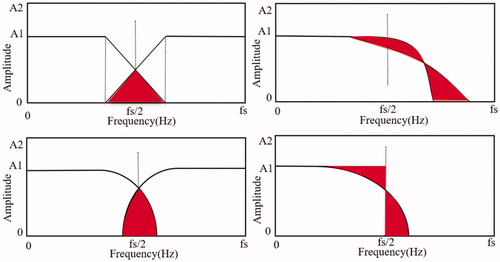
Figure 3. AFR of the ideal filter.
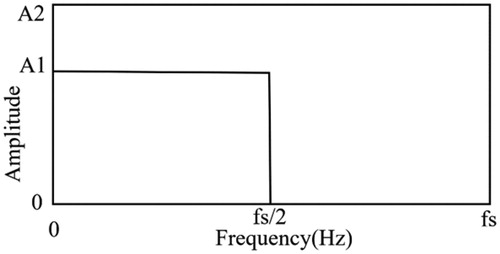
Table 1. Fibr wavelet coefficients.
Figure 4. The result of wavelet design (fibr wavelet). From the left to right: (a) The scaling function diagram (b) The wavelet function diagram.
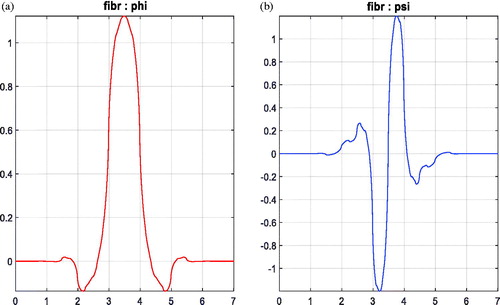
Table 2. Parameters of the acquisition equipment.
Table 3. Parameters using for generating F waves.
Figure 5. The average denoising effects on normal ECG.
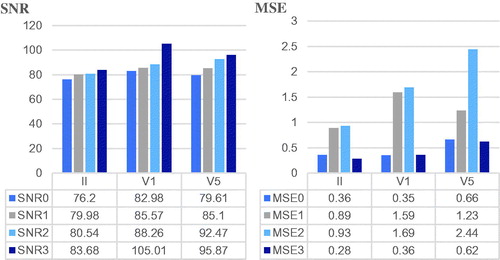
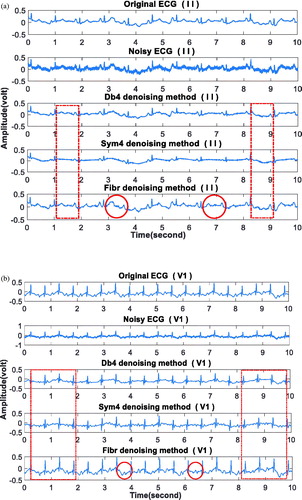
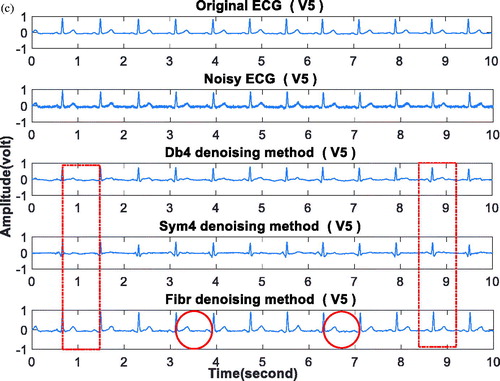
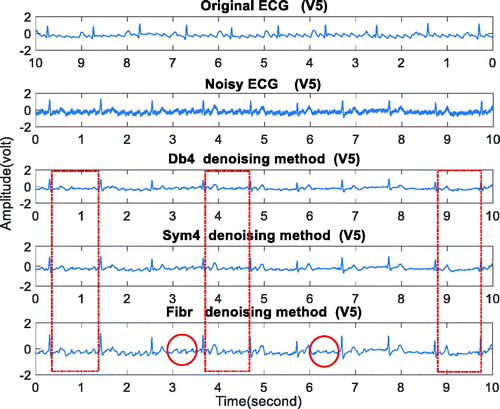
Figure 7. The denoising result under the noise with expected amplitude of 0.065 V.
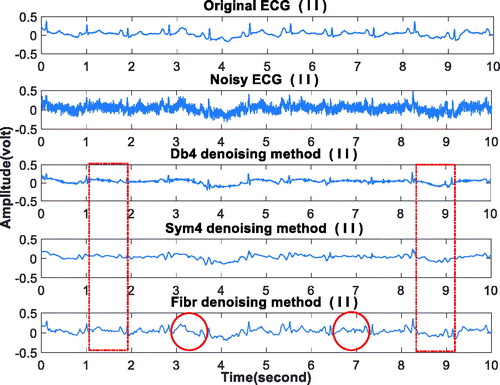
Figure 8. The average denoising effects at different noise levels.
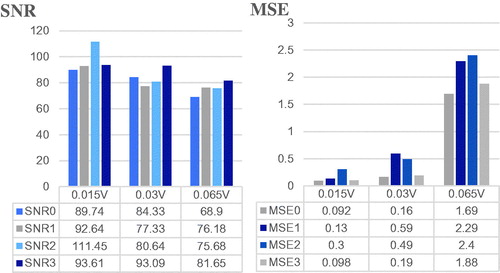
Figure 9. The average denoising effects on simulated AF signals.
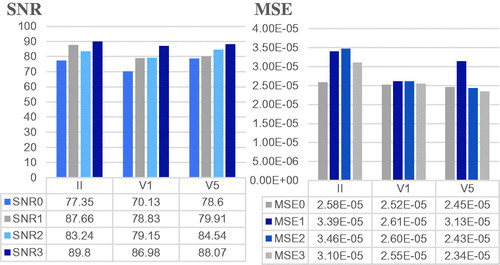
Figure 10. The denoising result on the simulated AF signal.