Figures & data
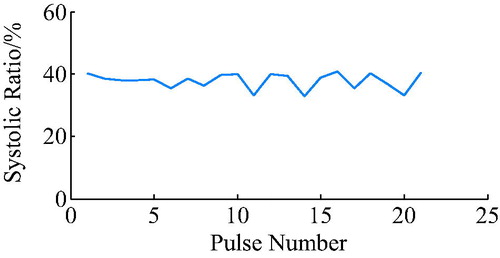
Figure 1. Relationship between ECG, aortic pressure, and heart sound signal at ventricular pressure.
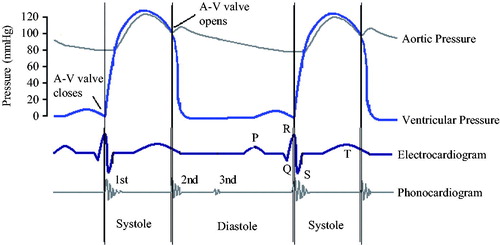
Figure 2. The synchronous control flow chart (ABP is aortic blood pressure, DN is dicrotic notch, S2 is the second sound).
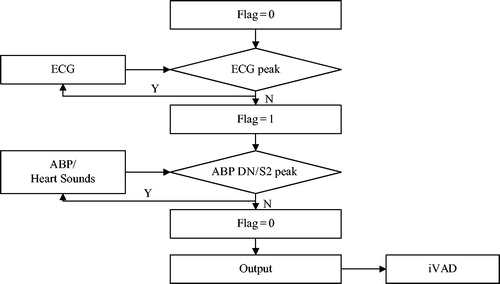
Figure 3. The home-made extracorporeal circulation simulation system.
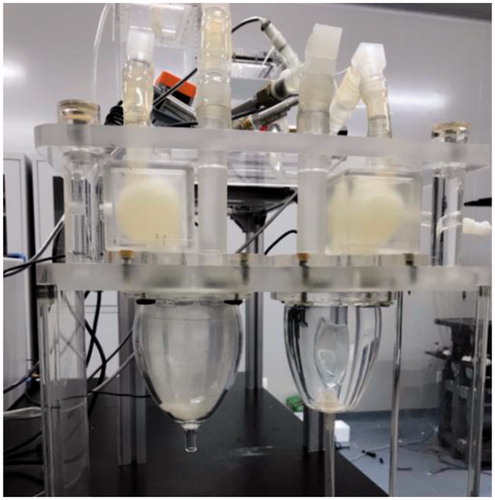
Figure 4. The signal acquisition and processing system framework.
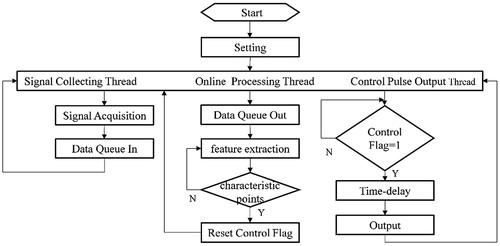
Figure 5. Synchronous ECG signal (a) and corresponding ventricular pressure (b).
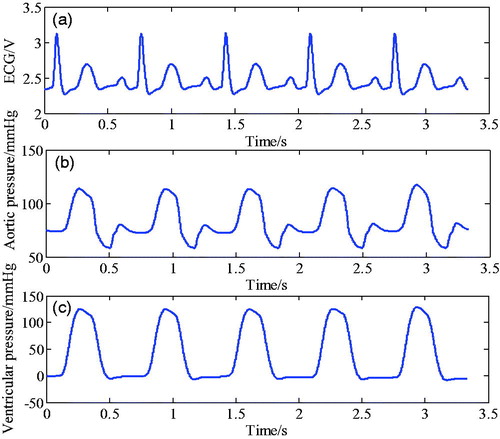
Figure 6. Start delay time of the electrocardiogram.
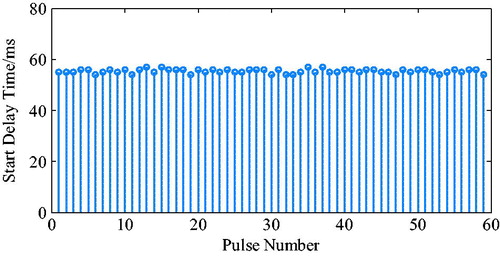
Figure 7. End delay time of pulse under different negative pressure conditions.
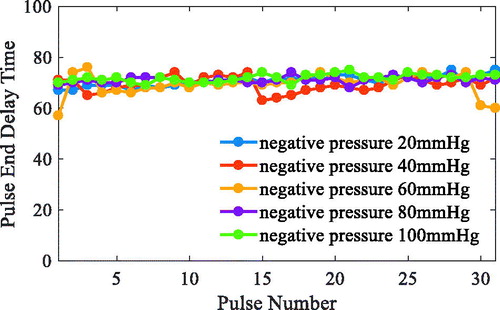
Figure 8. Heart systolic ratio using a combination of the ECG and fixed systolic ratio (35%).
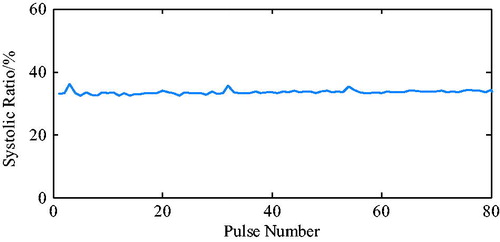
Figure 9. Synchronous electrocardiogram signal, arterial pressure, and corresponding ventricular pressure.
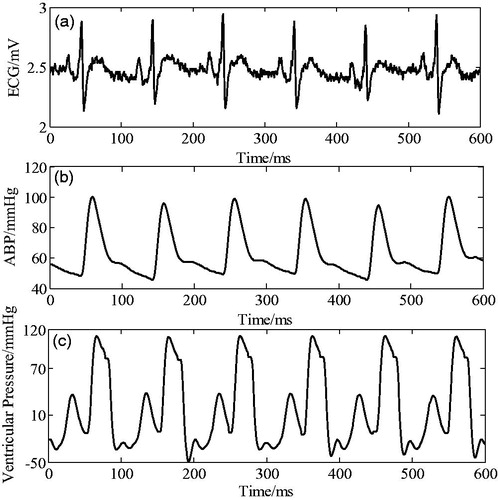
Figure 10. Start delay time of the electrocardiogram.
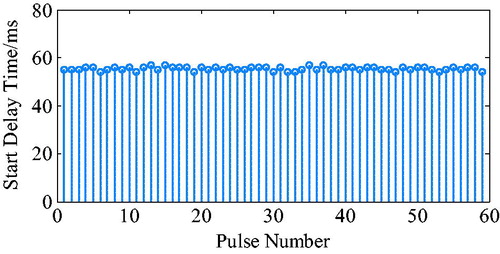
Figure 11. End delay time of the arterial pressure.
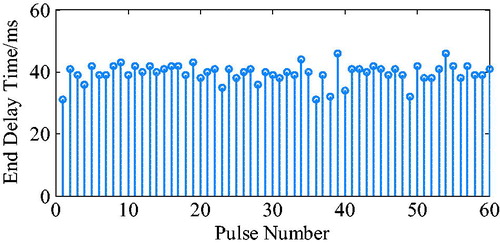
Figure 12. Heart systolic ratio by combining electrocardiogram and arterial pressure.
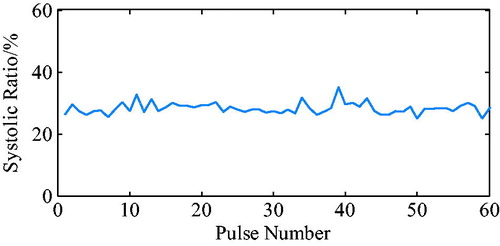
Figure 13. Synchronized ECG signal, heart sound, and corresponding ventricular pressure.
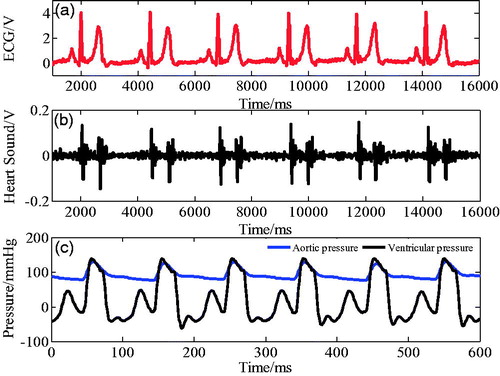
Figure 14. Start delay time of the electrocardiogram.
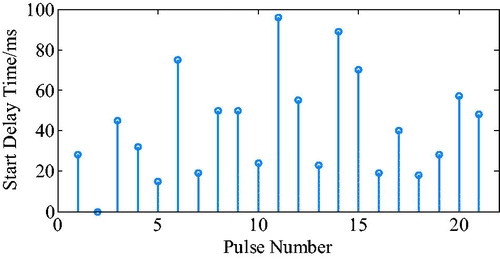
Figure 15. End delay time of heart sound.
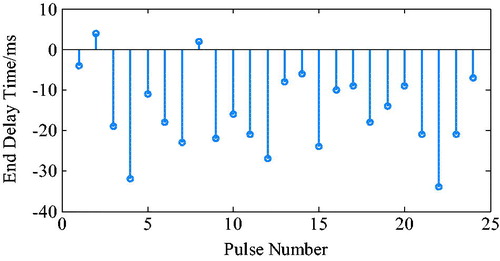
Figure 16. Heart systolic ratio when combining the electrocardiogram and heart sound.