
Figures & data
Figure 1. The training and validation error of the CNN, (a) our network without the STN; (b) our network with the STN.
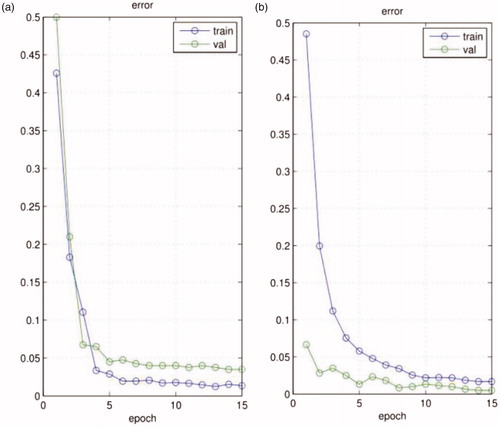
Figure 2. Specific network architecture of (a) the STN and (b) the classification network.
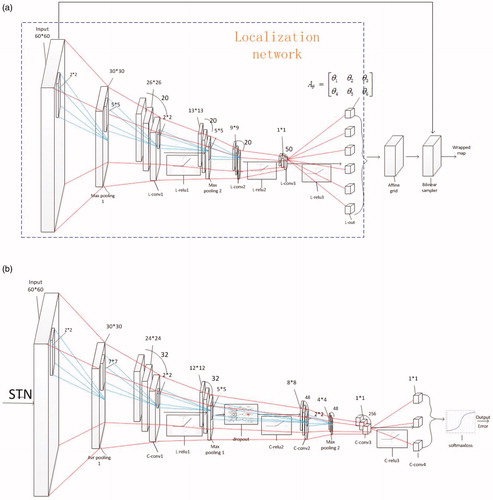
Figure 3. (a) Learning spatial context at the frame; (b) detecting an object’s location at the
frame and tracking.
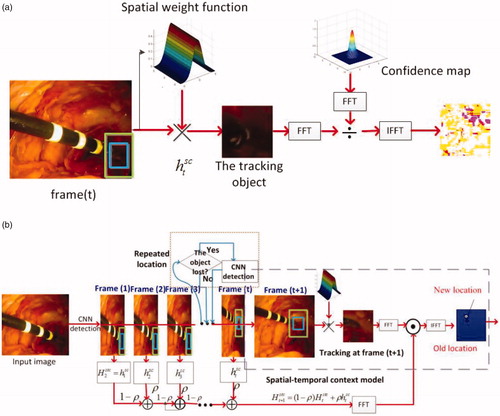
Figure 4. Test video images, from top to bottom, with rows showing the performance of our method, the MIL method, ATF method, DDVT method, and CF method on eight datasets, respectively. Every column represents one kind of dataset; the dataset names appear below each column.
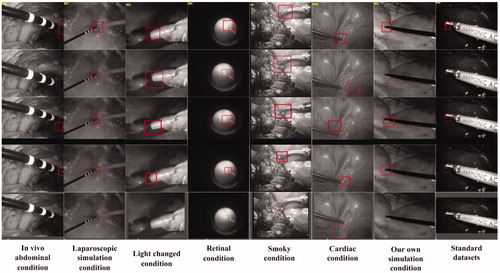
Figure 5. Each graph represents one kind of dataset and each colour line represents each method’s error; the dataset names appear below each graph. Red represents the error of our method, green that of the CF method, yellow that of the MIL method, black that of the ATF method, and blue that of the DDVT method.
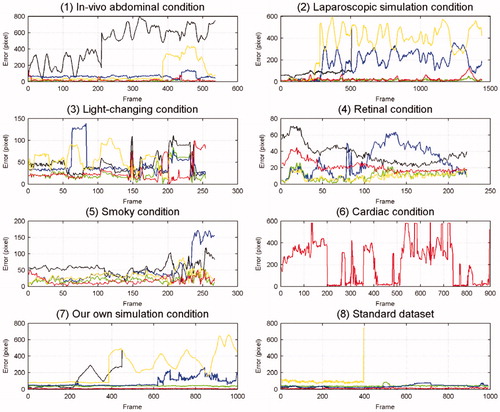
Table 1. Mean tracking errors (pixel) of every method on every dataset.
Table 2. Standard deviations (pixel) of every method’s tracking errors on every dataset.
Table 3. The trackers’ accuracy on every dataset; the accuracy have been calculated based on the distance between the ground truth and the tracking position. If the distance is smaller than the half length of side of the tracking window centred on the ground truth in one frame, we believe the tracker successfully track the object in this frame.
Table 4. Every method’s frames per second (FPS) on every dataset.