Figures & data
Figure 1. Schematic diagram of iVAD installation.
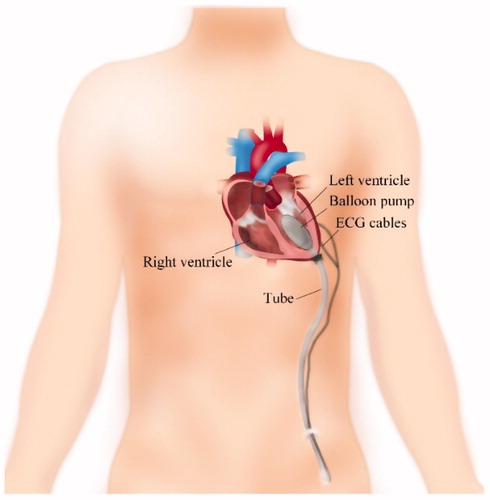
Figure 2. The pulsatile rhythm between the left ventricle and iVAD.
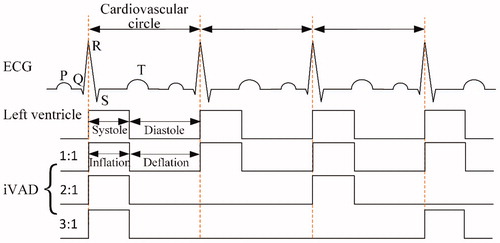
Figure 3. (a) Schematic of home-designed MCS, (b) Photo of the MCS.
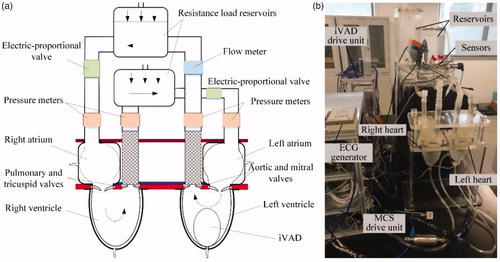
Figure 4. The timing relationship between ECG and aortic pressure and flow tested in MCS.
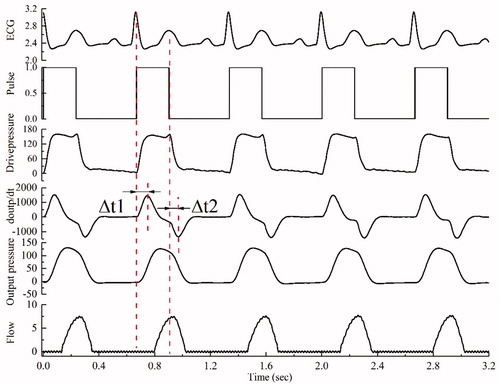
Figure 5. Time delays of drive pressure derivatives of the iVAD.
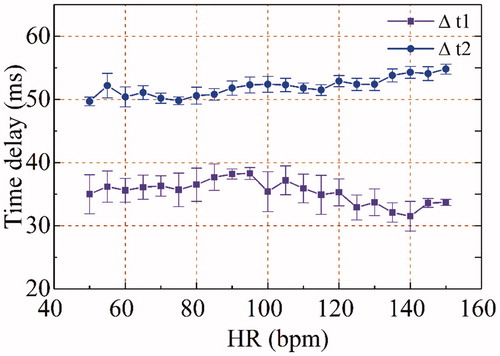
Figure 6. SV and CO of the iVAD varied with drive pressure at different HR and afterload. (a,e) 60 mmHg afterload, (b,f) 80 mmHg afterload, (c,g) 100 mmHg afterload, and (d,h) 120 mmHg afterload. The legend represents the drive pressure, mmHg.
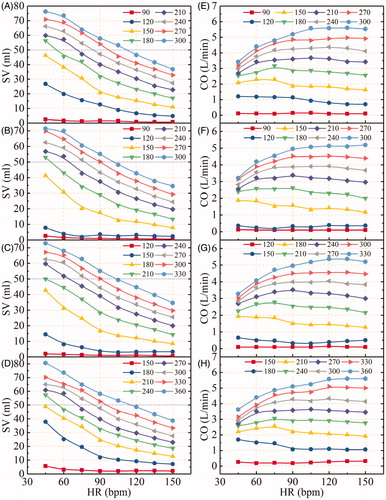
Figure 7. Pressure and flow waveforms under two conditions (baseline represent heart failure, and assisted mode represent iVAD support).
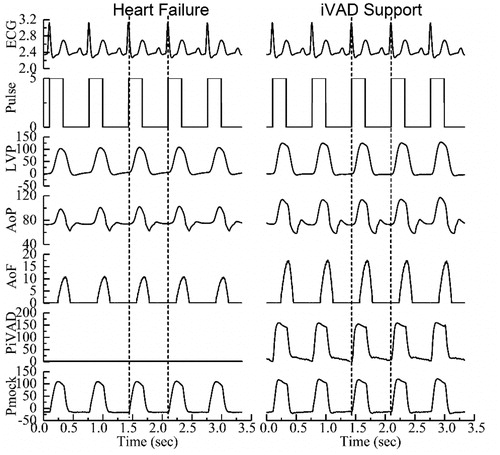
Table 1. The failure heart hemodynamics before and after iVAD support.
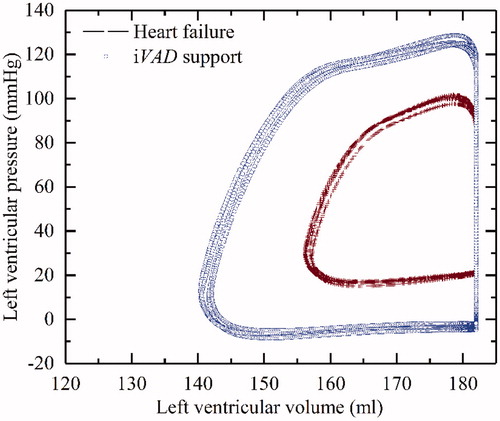
Figure 8. The pressure-volume loop of the failing ventricle before and after iVAD support at 150 mmHg drive pressure.