
Figures & data
Figure 1. Tactics integrates directly into the electrode insertion workflow. The system enables surgeons to plan their procedures using preoperative images of the patient. Surgeons can export and bring with them to the operating room a procedure report containing a checklist of electrode specifications and trajectories to be performed. During the procedure, operating room staff can plan and log any changes required during the procedure. After the procedure, surgeons can compare electrodes in postoperative images with the trajectories planned prior to the procedure. Surgeons or researchers can use Tactics to quantify any deviations from the plans for case validation and research studies.
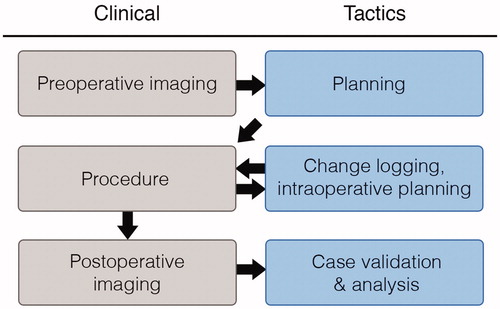
Figure 2. Scene generated by Tactics after importing preoperative images. The main view presents a volumetric representation of the data that can be observed by moving cross-sectional slices through the volume. The brain is automatically segmented from the images and is volumetrically rendered, as shown in the bottom left of the window. Fiducial markers of the stereotactic frame are identified as N-shaped fuchsia bars.
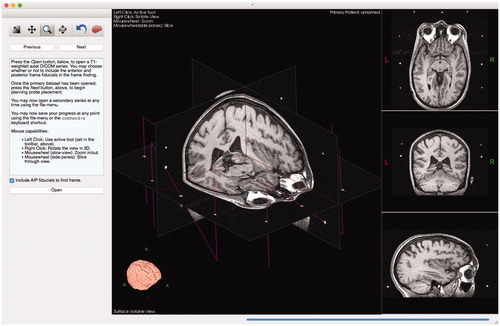
Figure 3. Example of surgical planning to implant deep-brain stimulation electrodes into subgenual cingulate for treatment of depression.
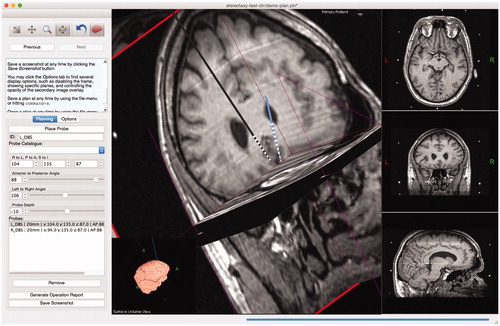
Figure 4. Tactics includes a user-extensible mechanism for planning with different lead specifications. Each lead design is a simple plaintext file that the system imports at startup. To include other lead designs, such as leads that match the designs of popular manufacturers, users need simply to create text files according to a simple format. By extending the catalog, users are able to plan, with much greater accuracy, positions of specific lead contacts to maximize surgical outcome.
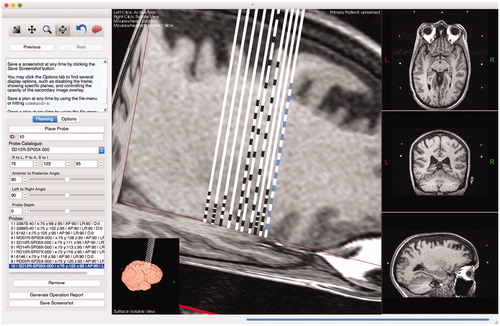
Figure 5. Users can maximize and interact with a surface view of the extracted brain, allowing them to visualize trajectories as they penetrate the brain. Modifications to the lead trajectories can be made in order to avoid cortical sulci or vessels.
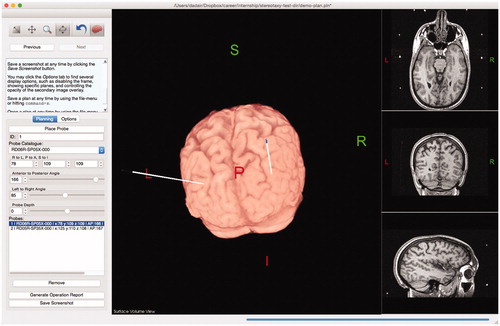
Figure 6. Users can import a secondary series that will be registered and overlaid on the preoperative data. The opacity of the secondary overlay can be controlled (slider shown in left sidebar). The implanted leads and their contacts are clearly shown to match the trajectories of the planned leads.
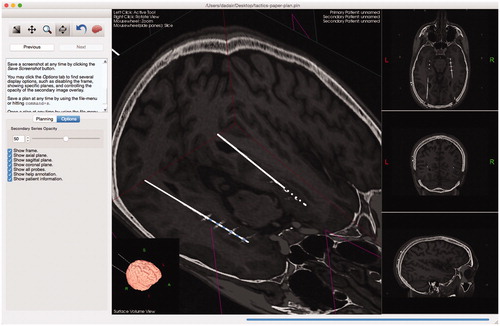
Figure 7. A depiction and example of a lead specification file. The file format is simple – it consists of primarily two components: whether or not the tip is itself a contact, specified by a Boolean value at the beginning of the file, and a list of absolute distances (in mm) from the tip of the lead marking the beginning and ending of individual contacts. The final number represents the total length of the lead.
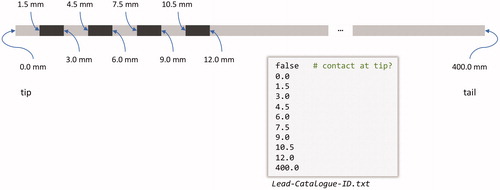
Figure 8. Blob selection (left) and cluster selection (right). Each cluster of blobs that corresponds to a tube undergoes principal component analysis. A single slice of the brain is shown for reference. It is typical for there to be some residual geometric distortion after correcting for the nonlinear gradient fields.
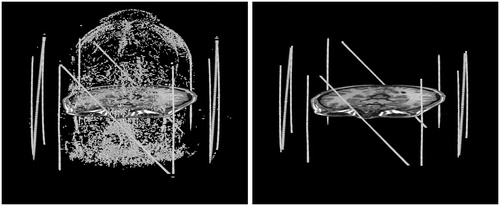
Figure 9. Frame localization using blog/cluster projections. (a) All of the blobs projected onto the X-axis. The outermost peaks are the clusters for the right and left fiducial plates. (b) The cluster for the right plate, projected onto the Y-axis. The peaks are the vertical tubes, and the plateau between them is the diagonal tube. (c) The cluster for the right plate, projected onto a diagonal line. The peak is the diagonal tube, and the plateaus to either side are the verticals.
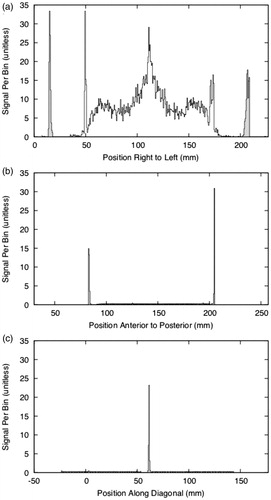
Figure 10. Initial validation of Tactics was performed through surgeons planning biopsies using Tactics alongside their standard techniques. Here, a neurosurgeon plans a target and trajectory for a brain tumor biopsy using Tactics.
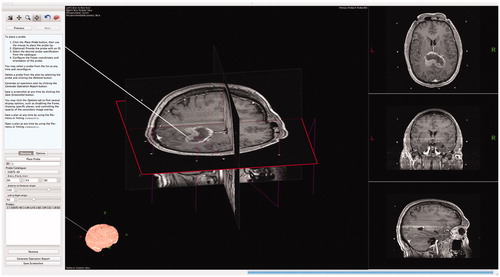
Figure 11. Targeting fiducial markers in a phantom using Tactics. The center of each circular fiducial marker was targeted by an expert and compared against known coordinates from the attached stereotactic frame. The expert was blind to the known coordinates.
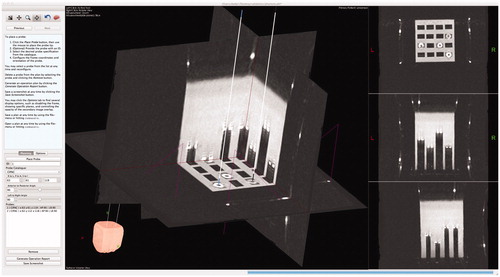
Table 1. Cases (n = 14) collected for retrospective analysis between planned target lead coordinates and final positions as identified in postoperative imaging and determined in Tactics.
Figure 12. Quantitative analysis of targeting accuracy and retrospective case validation. (a) Euclidean distance (mm) between coordinates of fiducials targeted with Tactics and coordinates measures with the Leksell G-frame; (b) localization error (distance between true frame coordinates on the imaging phantom and virtual targeting coordinates) along each Leksell G-frame coordinate axis, demonstrating statistically insignificant deviation from an expected mean of 0 mm for each axis in the sample; (c) distance between the planned and performed placements for 20 lead placements from 14 retrospective cases, demonstrating both variability in final lead placements despite careful planning and setup of the Leksell G-frame, and the capability of Tactics as a case validation and analysis tool.
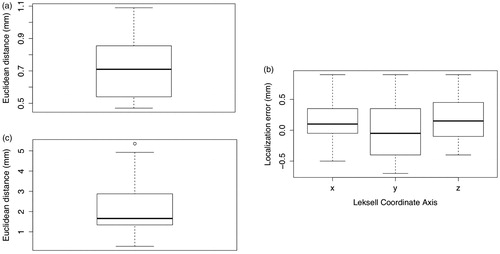
Table 2. Tactics localization error based on physical Leksell localization of fiducials in a targeting phantom compared to virtual localization of the fiducials in the imaged phantom using the software.