
Figures & data
Figure 1. Flowchart of knowledge graph construction.
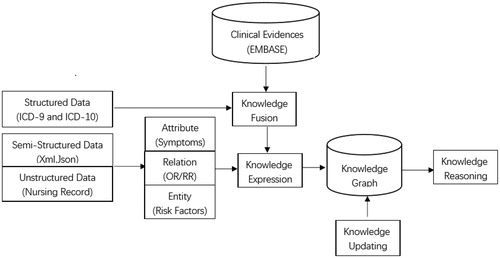
Figure 2. Knowledge graph for DM complication. (Gray nodes: life style risk factors; yellow nodes: DM complications.)
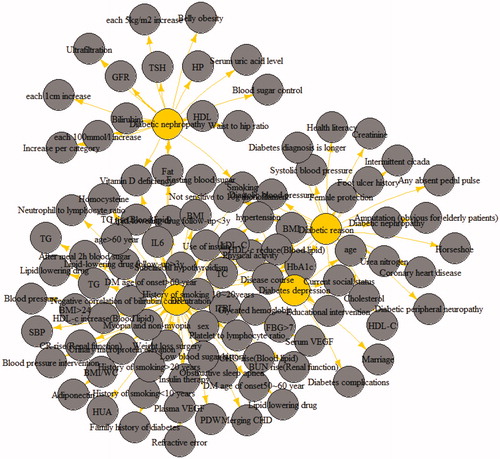
Figure 3. Visualization of personalized prediction results in the knowledge graph (a, b, c, d represented the four test cases in ).
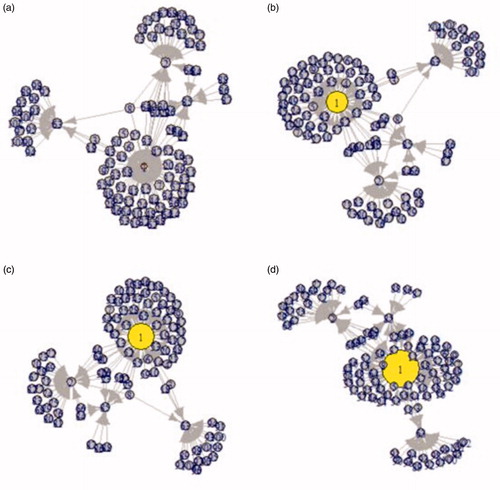
Table 1. Risk score predicted using the constructed model in four test cases.