
Figures & data
Figure 1. X-Atlas™ Imaging Technology Process. (a) A 3D scene representing the position of the patient relative to the source and image detector during x-ray acquisition is created. (b) The patient’s specific bony landmarks are defined on the AP and lateral images (e.g. femoral head). (c) The patient’s femoral and tibial bone contours are outlined on the AP and lateral images, which capture unique features of the patient’s bony anatomy. (d) A mean bone model for the femur and tibia is positioned and scaled in the 3D scene inside the patient-specific contours. (e) An automatic bone deformation is performed to match the 3D mean bone model to the patient-specific contours to fit the patient’s anatomy. (f) An estimated cartilage thickness is calculated (half distance between bones on a weight-bearing AP x-ray) and applied to the femoral and tibial bones. Dotted line: Patient’s bone contour; Solid line: Projected mean bone contour; Dashed line: Deformed bone contour; Black area (distal end of bones): Added cartilage.
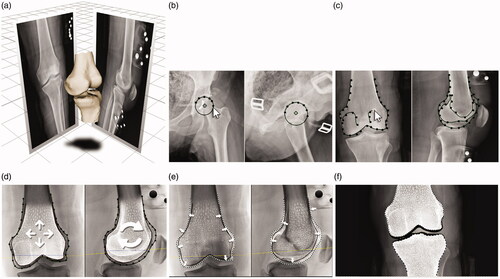
Figure 2. Placement of the X-PSI™ femoral guide. The X-PSI™ femoral guide was placed on the distal femur by first positioning the anterior tab on the anterior cortex and locking on the anterior part using the medial and lateral tabs. The metallic blades aligning with the distal condyles were then pushed by hand through the cartilage until they contacted the cortical bone. The guide position was confirmed using marks on the guide indicating the mechanical axis entry point and Whiteside’s line (bottom left image). Because the cut guide sits on specific contact points (unlike MRI-based PSI systems), the surrounding soft tissues do not interfere with the installation and positioning of the femoral guide (bottom right image).
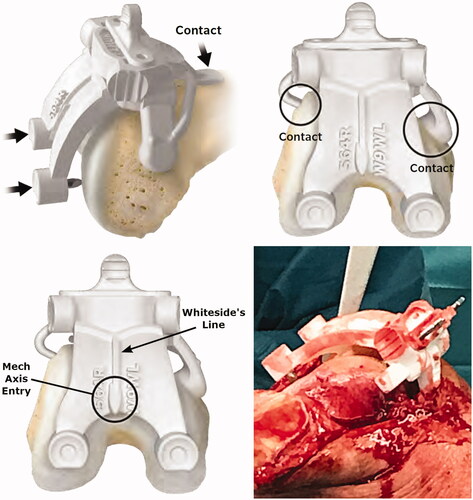
Figure 3. Measurement of positioning accuracy. (a) For the distal femoral resection, the validation tool without the condyle digitizer is applied to the resected surface to acquire the angle; (b) For the proximal tibial resection, the validation tool with the condyle digitizer is applied to the resected surface to acquire the angle.
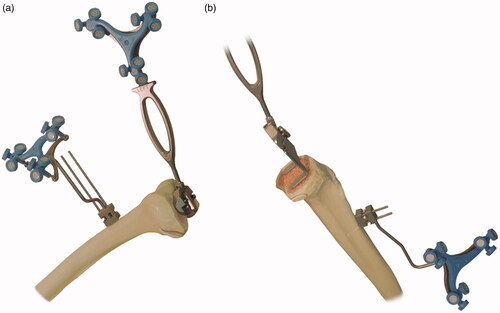
Figure 4. Placement of the X-PSI™ tibial guide. The X-PSI™ tibial guide’s patient specific ankle clamp was placed around the patient’s malleoli. Then, the pointer at the proximal end of the guide was placed on the tibia’s mechanical axis entry point, making sure the guide contacted the anterior surface of the tibia. The tibial guide was aligned in the axial plane with the medial third of the tuberosity and posterior cruciate ligament (PCL) insertion.
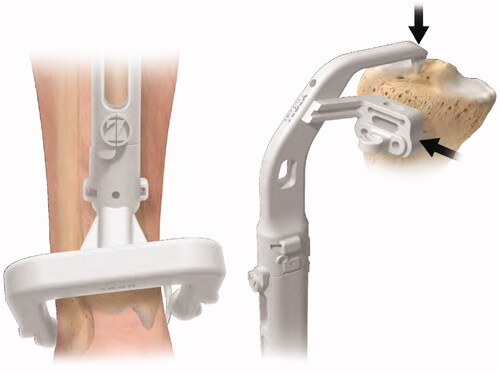
Table 1. Patient demographics.
Table 2. Accuracy of X-Atlas™ imaging technology.
Table 3. Accuracy to plan of the laboratory validation study.
Table 4. Accuracy to plan of the clinical study.