
Figures & data
Table 1. Patient characteristics.
Figure 1. (a–c) Intraoperative setting. Positioning of the O-arm™ Imaging system after fixation of the patients head in a patch clamp (a), transfer of the injection protocol to the automatic injector (b), example for radiation and image settings displayed on the panel of the O-arm™ Imaging system (c).
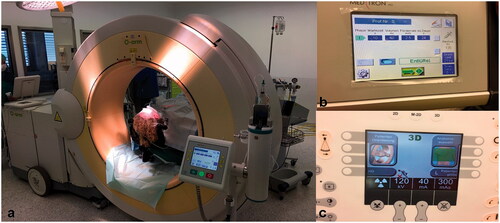
Figure 2. Contrast injection protocol. For image acquisition, a 24 s scan was used (‘high definition mode’ or ‘enhanced cranial mode’ of the Medtronic O-arm). Fluoroscopy was started with a delay of 12 s after contrast injection was started. This delay was calculated to be the approximate circulation time of the contrast agent administered via a central venous catheter until it appears in the cerebral circulation.
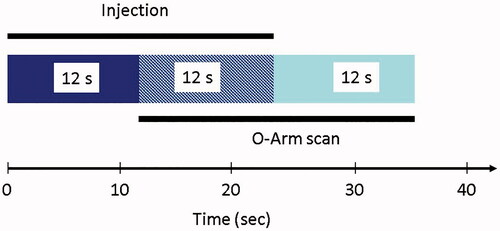
Figure 3. (a–d) Results of the assessment of image quality regarding depiction of the vessel tree before surgery (a), after clipping (b) and of distal vessel patency (c) and aneurysm occlusion (d) after placement of the clip. In subfigures (a) and (b), raw images, maximum intensity projections and subtracted images were assessed separately.
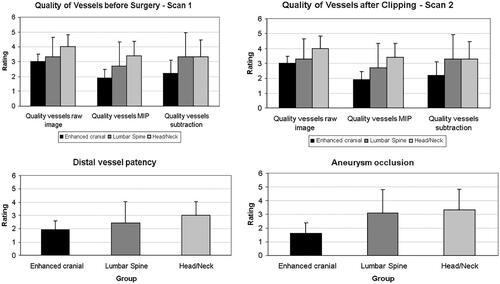
Table 2. Intaoperative ICG and postoperative DSA.
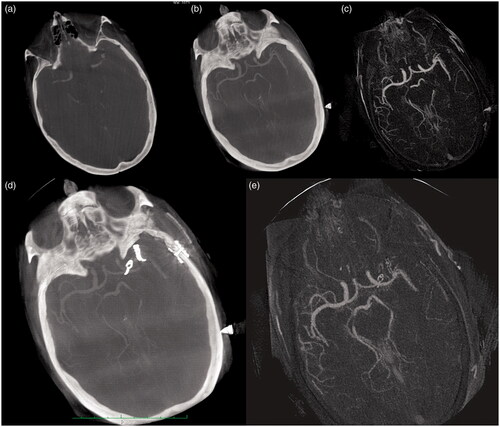
Figure 4. (a–e) Small aneurysm of the carotid bifurcation and MCA in basic (raw) images (a), using the MIP function of the OsiriX software (b) and MIP function of the subtracted images (c) before placement of the clip. Postoperative control in basic image (d) and subtracted images (e). Neither preperatively nor after placement of the clip, subtraction of native and contrast-enhanced images showed a gain of image quality.
Data availability statement
The datasets used and/or analyzed during the current study are available from the corresponding author on reasonable request.