
Figures & data
Figure 1. A blank DRR based on unprocessed CT data (l) and a DRR based on CT data on which the anterior iliac surface just lateral to the SIJ has been highlighted on the left and right side (r). The white lines on the right DRR correspond to lines that are used for perioperative lateral alignment.
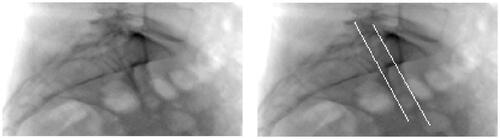
Figure 2. A blank DRR after realigning the CT data (l) and a DRR based on realigned CT data on which the anterior iliac surface just lateral to the SIJ has been highlighted on the left and right side (r).
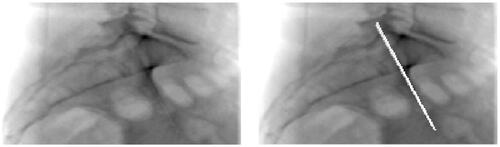
Figure 3. Overview showing the perioperative fluoroscopy images (first column) for the outlet (first row), inlet (second row) and lateral (third row) view. The corresponding DRR reconstruction is shown in the second column and the DRR including the superimposed S1 and s2 neural foramen segmentation can be seen in the third column. The fourth column shows the perioperative fluoroscopy with the superimposed, registered S1 and S2 neural foramen segmentation.
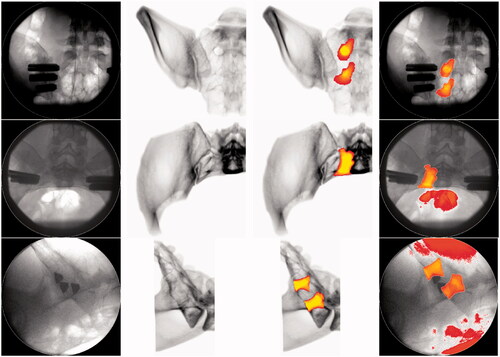
Table 1. Mean and standard deviation of the Euclidean displacement distances between ten corresponding reference points selected on the fluoroscopy and registered DRR.