
Figures & data
Figure 1. Optical markers attached on the femur and the tibia.
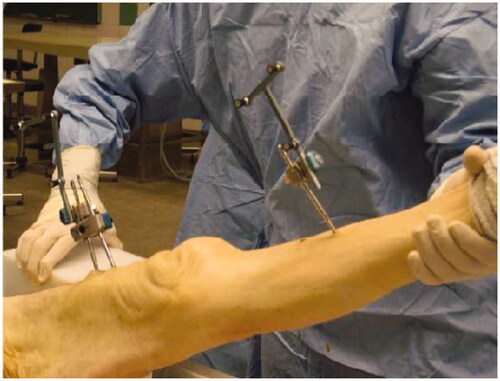
Figure 2. Definitions of the knee center explained on a schematic.
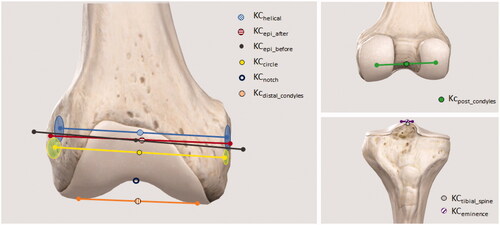
Figure 3. Boxplot of precision for nine definitions of the Knee Centers. The middle line represents the median, the box extends from the lower to the upper quartile, and the vertical line extends from the first decile to the ninth decile. Values which are inferior or superior to respectively the first and the ninth deciles are represented by separated points. Solid triangles in each box represent the mean precision values.
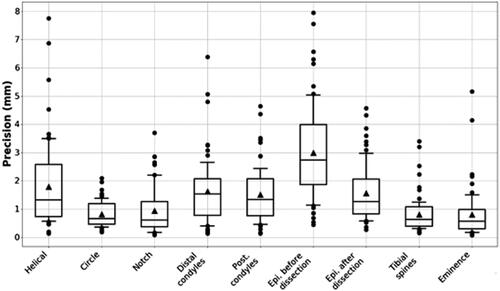
Table 1. HKA precision (mean ± SD, (min–max)) in degrees according to the KC and the FP definitions.
Table 2. HKA accuracy (mean ± SD, (min–max)) in degrees according to the KC and the FP definitions.
Table 3. p-Values between FP and KC combinations and either the FPhelical – KCnotch (top) and FPhelical – KCtibial_spines (down) for the accuracy (NA: Not Applicable).