
Figures & data
Table 1. Contact pressure results obtained for each tibial rotation with mean pressures (Psi) and range in brackets.
Table 2. Number of TKA exceeding maximal recommended contact pressure at each tibial rotation (n = 12).
Figure 1. (a–c) Box and whisker plots of intercompartmental pressure differences(psi) observed when tibial component rotated to each tibial rotational landmark at 10°(a), 45°(b) and 90°(c) of knee flexion.
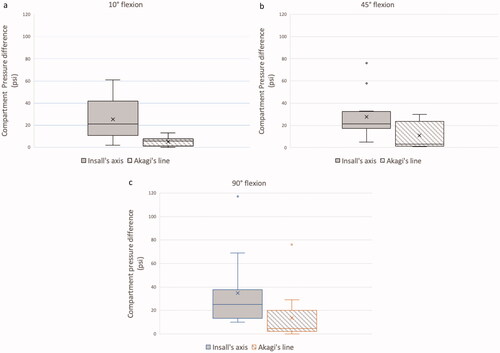
Table 3. Number of TKA balanced at each tibial rotation (n = 12 patients).