
Figures & data
Figure 1. (a) Configuration of the conventional SSM for femur reconstruction. (b) From the conventional SSM, the new SPSSM is constructed and used to produce a more patient-specific reconstruction of a 3D femur model.
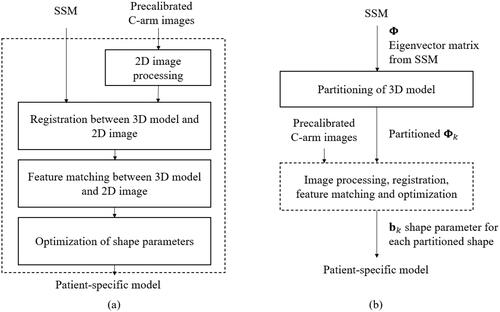
Figure 2. (a) C-arm images and extracted outer boundary shown as a blue curve. (b) Vertex points are shown as blue dots, and the vertices of their outer boundary are extracted and shown as red dots.
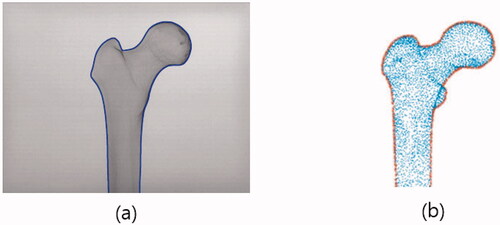
Figure 3. Matching between the 2 D boundary points and projected points of the 3 D model vertices before optimization (a) and after optimization (b). A pair of matched points are linked by a line. After optimization, the red dots are rearranged, which results in lower cost, as shown clearly in (b).
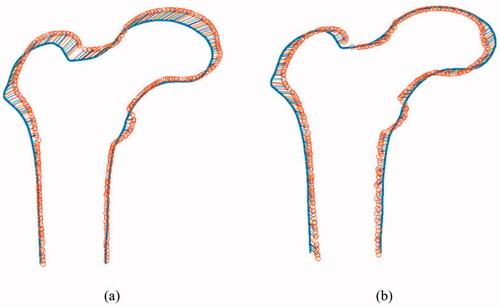
Figure 4. Samples of 3 D femur surface models were constructed from the CT images used in the experiments.
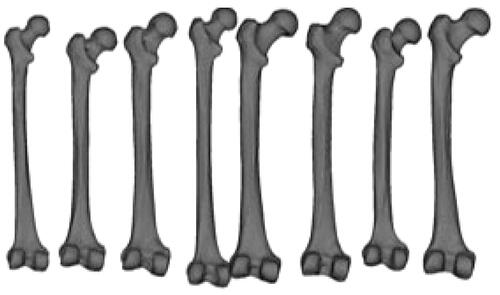
Figure 5. (a) Deformed 3 D model in which the deformation of the anteversion angle is 30˚. This deformed target was generated from the original No.10 femur. (b) C-arm images for the proximal and distal parts. The first column corresponds to C-arm images with a 0˚ view angle, whereas the second column corresponds to C-arm images with a 30˚ view angle. (c) Corresponding DRR images were obtained from the deformation model.
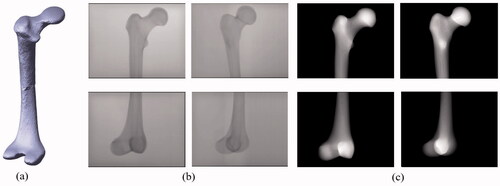
Figure 6. Angle deformation of femoral anteversion. (a) Mean model used in SSM and SPSSM. (b) Deformed target shape to be adapted by SSM and SPSSM. (c) Top view of the femoral shape reconstructed using conventional SSM. (d) Top view of femoral shape reconstructed using SPSSM.
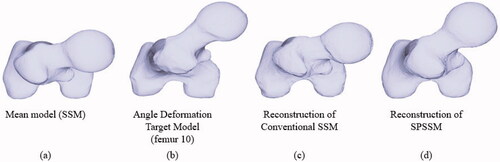
Table 1. Reconstruction error of the conventional SSM and the proposed SPSSM for the anteversion angle deformation model for X-ray images and DRRs. The RMS point-to-surface distance is used as a reconstruction error measure.
Figure 7. Experiment on scale deformation of the femoral head. (a) Mean model used in SSM and SPSSM. (b) Deformed target shape with smaller femoral head to be adapted by SSM and SPSSM. (c) Frontal view of the femoral shape reconstructed using conventional SSM. (d) Frontal view of femoral shape reconstructed using SPSSM. (e) Deformed target shape with the larger femoral head. (f) Frontal view of femoral shape reconstructed using conventional SSM. (g) Frontal view of femoral shape reconstructed using SPSSM.
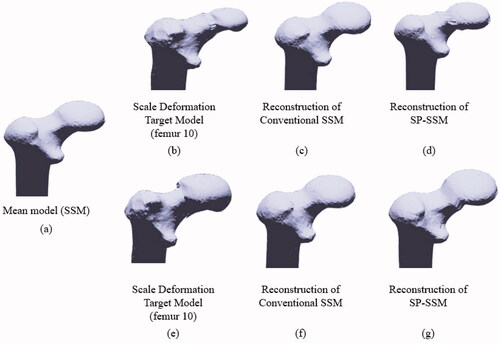
Figure 8. Two poses of DRR images were used to evaluate the scale deformation model. The femoral head of the proximal part is artificially enlarged by 20% in the deformation model.
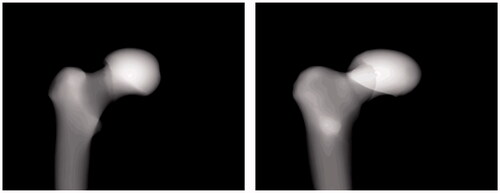
Table 2. Reconstruction error of the conventional method and the proposed method with two different sizes in the head scale deformation model. The head part was reduced by 20% or increased by 20% in the model.