
Figures & data
Figure 1. Intra-operative set up of Intellijoint KNEE during the femur cut verification step. The 3D mini optical navigation device consists of an infrared camera within the sterile field which tracks markers on the bone tracker (mounted on the femur or tibia) and the probe tracker which fits into the cutting guide slot to verify the cut. Data is relayed to the computer workstation outside of the sterile field and displayed in real time. The device can be controlled by the surgeon with the buttons on the camera or by an assistant at the workstation.
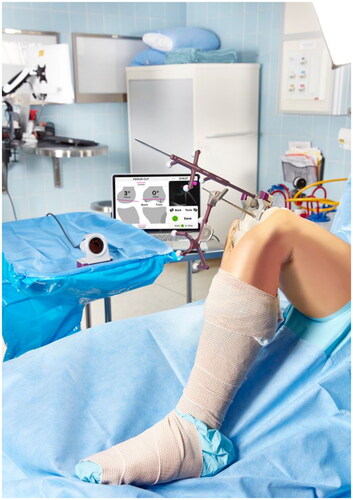
Figure 2. The Top image depicts the landmarks on the femur: (i) lateral condyle, (ii) femur center, (iii) medial condyle, solid line is the AP axis (whiteside’s line), dashed is the posterior condylar axis. The image below depicts the tibial landmarks: (iv) medial third of the tibial tuberosity (MTT) and (v) the PCL insertion point, solid line is the AP axis.
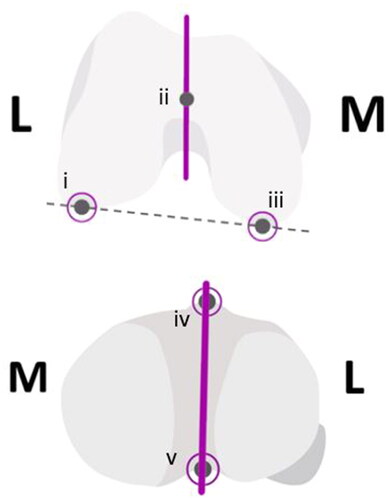
Figure 3. Bland-Altman plots showing agreement between intraoperative device (Intellijoint KNEE; IJK) measurements and post-operative CT scans for varus/valgus (A) and combined femur flexion and tibial slope (B). The average difference between the two measurements is expressed relative to the average of the two (n = 20; two values from each of the ten cadaveric knees utilized in the coronal and sagittal measurements). 100% of paired measurements were within the statistical limits (±1.96 × SD, dashed lines) for acceptable agreement in varus/valgus and 95% were within the statistical limits for femur flexion/tibial slope.
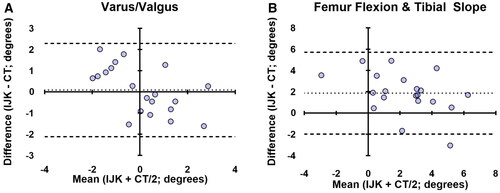
Figure 4. Bland-Altman plots showing agreement in the transverse plane cuts guided by Intellijoint KNEE (IJK) including femur rotation (A) and tibial rotation (B). the average difference between the two measurements is compared with the average of the two measurements. 100% of paired measurements were within the statistical limits (±1.96 × SD, dashed lines) for acceptable agreement in tibial rotation and 93% of measurements were in agreement for femur rotation. The femoral rotation values combine data referenced from both whiteside’s line and the PCA (n = 14), while tibial values are derived from the PCL-MTT axis only (n = 7).
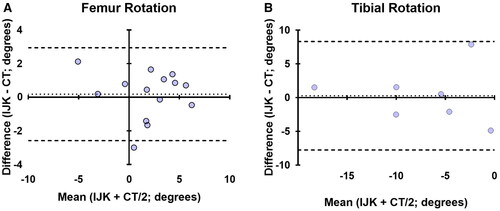
Table 1. Angular intraoperative values from the device’s use during cadaveric laboratories compared to post-operative CT scan results.