
Figures & data
Figure 1. Interactive visualization of disease prediction models and gallbladder disease diagnosis.
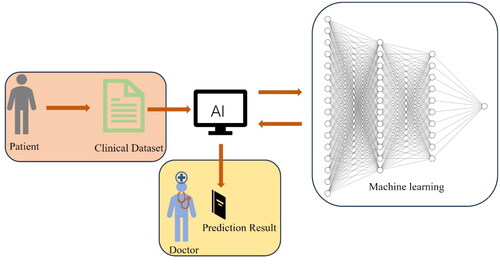
Figure 2. GBNet model.
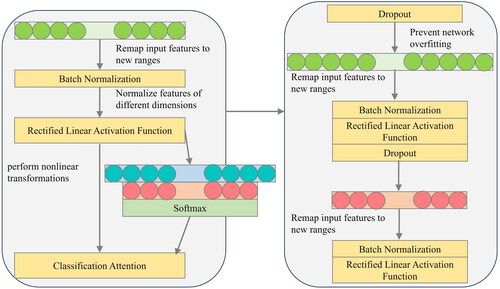
Table 1. Comparative experiments of different classification models oriented to the gallbladder categories change dataset.
Figure 3. Normalized confusion matrix.
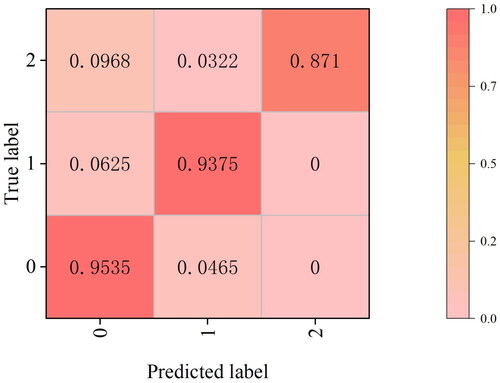
Figure 4. PR curve and ROC curve.
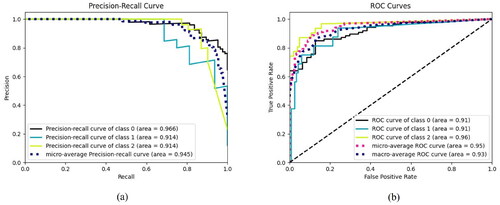
Figure 5. Visualization of the influence of physiological characteristics on the occurrence of lesions in the gallbladder.
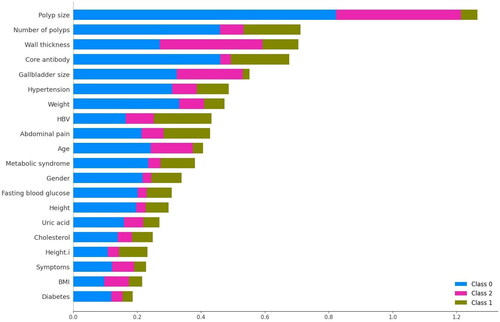
Table 2. Correlation analysis of physiologic features affecting carcinogenesis of the gallbladder.
Table 3. Binary logistic regression analysis of physiological characteristics influencing the development of carcinoma in the gallbladder.