
Figures & data
Table 1. Past vs. present: comparison of MR IGS in or.
Figure 1. PRISMA chart—inclusion and exclusion criteria.
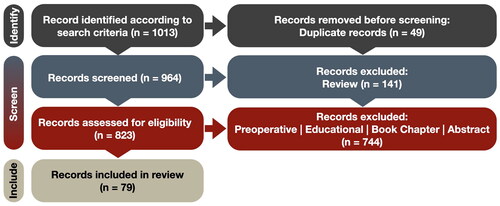
Table 2. Base exclusion reason categories and counts (2022–2024).
Figure 2. Distribution of imaging modalities in different studies.
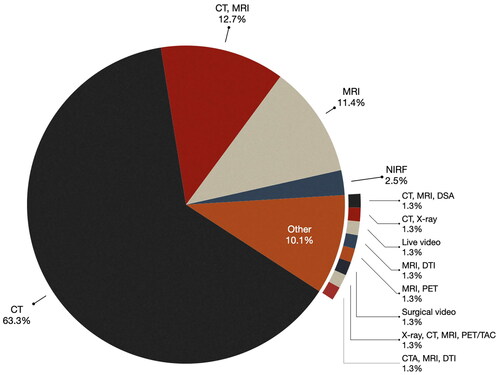
Figure 3. Different types of visualized data and processing. (A) CT slice image visualized in corner of Google Glass [Citation25]. (B) Contours and transparency used in BrainLab’s HUD showing lesion (yellow), the carotid arteries (blue), the chiasm (yellow), and the optic nerves (orange) [Citation26]. (C) Wireframe mesh rendering of uterus with tumor shown in yellow [Citation27]. (D) Surface rendering of spine, vasculature, and tumor anatomy as seen through the HoloLens [Citation28]. (E) Volume rendering of vessels in neurovascular surgery with colors representing venous/arterial flow [Citation29].
![Figure 3. Different types of visualized data and processing. (A) CT slice image visualized in corner of Google Glass [Citation25]. (B) Contours and transparency used in BrainLab’s HUD showing lesion (yellow), the carotid arteries (blue), the chiasm (yellow), and the optic nerves (orange) [Citation26]. (C) Wireframe mesh rendering of uterus with tumor shown in yellow [Citation27]. (D) Surface rendering of spine, vasculature, and tumor anatomy as seen through the HoloLens [Citation28]. (E) Volume rendering of vessels in neurovascular surgery with colors representing venous/arterial flow [Citation29].](/cms/asset/64132fbc-714a-4181-8222-ee54c172c0fa/icsu_a_2355897_f0003_c.jpg)
Figure 4. Distribution of visualization processing in different studies.
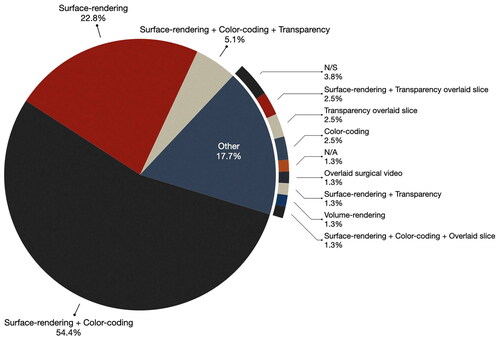
Table 3. Categorization of the papers based on the settings used for data visualization.
Figure 5. Examples of display types used for MR IGS. (A) Google Glass allows for the projection of simple images/text in the corner of the glasses [Citation25]. (B) The HoloLens HMD displays holograms of preoperative plans and anatomy in the surgical field of view in an abdominal cancer surgery case [Citation28]. (C) An iPad device used to show an AR view of the patient anatomy in neurosurgery [Citation42]. (D) The monitor of the neuronavigation system is used to show the AR view [Citation29]. (E) The surgical microscope’s HUD can be used to show the AR view in the oculars [Citation17].
![Figure 5. Examples of display types used for MR IGS. (A) Google Glass allows for the projection of simple images/text in the corner of the glasses [Citation25]. (B) The HoloLens HMD displays holograms of preoperative plans and anatomy in the surgical field of view in an abdominal cancer surgery case [Citation28]. (C) An iPad device used to show an AR view of the patient anatomy in neurosurgery [Citation42]. (D) The monitor of the neuronavigation system is used to show the AR view [Citation29]. (E) The surgical microscope’s HUD can be used to show the AR view in the oculars [Citation17].](/cms/asset/8a0cc695-1b0d-4f66-b1d2-7a1b6608e2a8/icsu_a_2355897_f0005_c.jpg)
Figure 6. Display devices utilized to view visualized data.
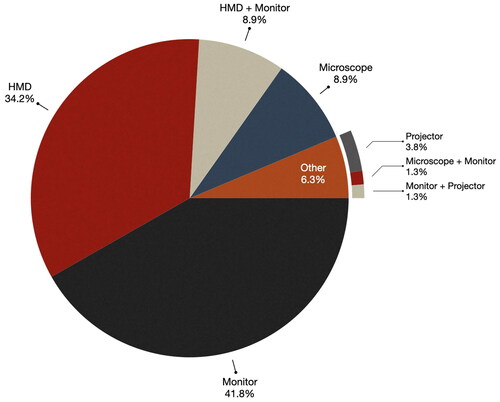
Figure 7. Type of surgery: comparison between the 2013 review [Citation2] and the current review for the count of papers for each type of surgery.
![Figure 7. Type of surgery: comparison between the 2013 review [Citation2] and the current review for the count of papers for each type of surgery.](/cms/asset/fd1aad9a-855a-4d78-ac87-0176c9bc5e29/icsu_a_2355897_f0007_c.jpg)
Figure 8. Surgical domains: the chart displays surgical domains using generic categories, with ‘spine surgery’ falling under ‘neurosurgery’ as a superclass.
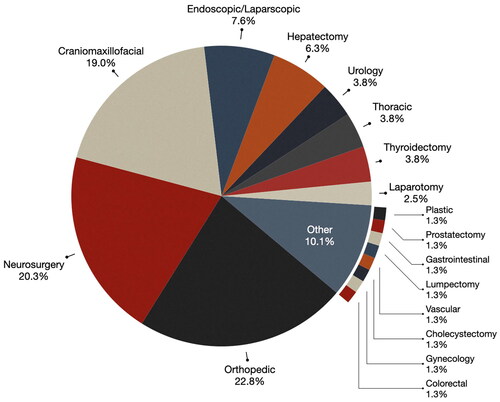
Table 4. The number of cases studied across various types of surgeries (other includes plastic, hepatectomy, gastrointestinal, gynecology, colorectal, lumpectomy).
Table 5. Included studies: evaluated or validated components (≥15 patients).