Figures & data
Table 1. Collection information, museum vouchers, and GenBank Accession numbers for samples used herein.
Table 2. PCR primers for Sanger sequencing across gene junctions. *Modified slightly from cited publication.
Table 3. Pennatulacea samples and NGS data details used in this study.
Table 4. Pennatulacea mitochondrial gene lengths (base pairs), intergenic regions (positive values) and overlapping genes (negative values) (base pairs) in specimens in this study with gene order A. Intergenic regions are represented in italics.
Table 4. Continued.
Figure 1 Pennatulacea mitochondrial genome arrangements (linearized). Gene order A (octocoral ancestral gene order): 14 pennatulacean species of our study (). Gene order B: Anthoptilum spp. New gene order (G): Umbellula sp. 1. Bipartite mitochondrial genome: Umbellula sp. 3. Different colors correspond to the four octocoral conserved gene blocks (block 1, red: cox1–rns–nad1–cob; block 2, blue: nad6–nad3–nad4l; block 3, yellow: mtMutS–rnl–nad2–nad5–nad4; block 4, green: trnM–cox3–atp6–atp8–cox2). Arrows indicate the direction of replication. Highlighted lines mark gene block transcript direction that differ from the ancestral gene order (A).
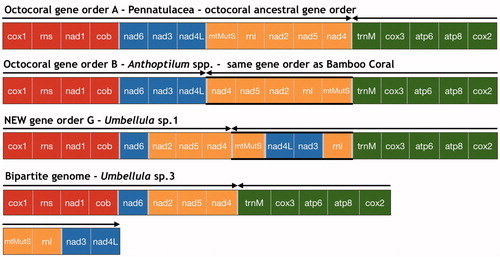
Table 5. Pennatulacea mitochondrial gene lengths (base pairs), intergenic regions (positive values) and overlapping genes (negative values) (base pairs) in specimens in this study with gene order B (Anthoptilum spp.), G (Umbellula sp. 1) and the bipartite genome (Umbellula sp. 3).
Table 6. Mitochondrial genome nucleotide composition of Pennatulacea of this study.
Table 7. Presence of inverted repeats and A-T rich stem-loop as evidence for OriL.
Figure 2. DNA-Walk (Graph DNA) vectorial representation of linearized pennatulacean mitochondrial genomes into a 2 D trajectory along the genome. Every nucleotide direction is determined by the compass in the left corner, representing a cumulative skew (window size: 900). a: gene order A. b: gene order B. c: new gene order G. d: bipartite genome. Genes and IGRs are marked in the abrupt inversions in base composition bias, which can be an indicative of origin of replication (suggested IGRs marked in bold and underline). Sequences start at the middle of cox2 (*) and finish at the middle of cox2 (.), except for Umbellula sp. 3 (contig ii) which starts at mtMutS (*) and finishes at nad4L (.). Dashed line represents the overall DNA-Walk shape for gene order A.
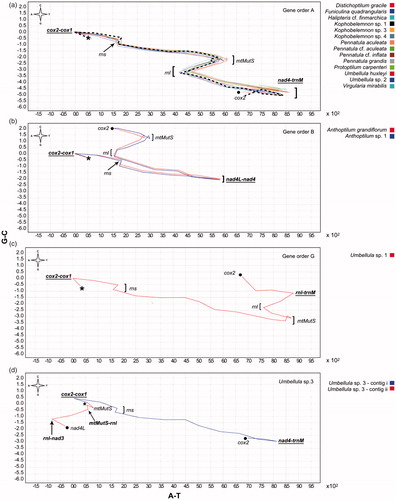
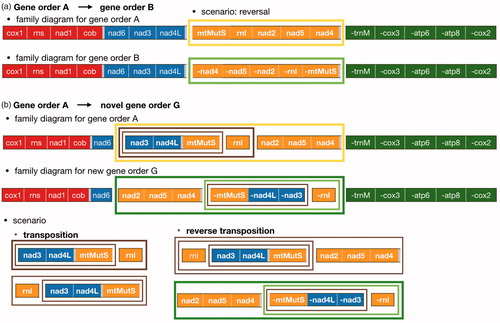
Figure 3. Scenarios of the possible mechanism of the mitochondrial gene rearrangement using parsimony hypothesis in CREx. a. Transition from gene order A to gene order B. b. Transition from gene order A to gene order G. Small coloured rectangles correspond to the four octocoral conserved gene blocks (block 1: red; block 2: blue; block 3: yellow; block 4: green). Highlighted coloured rectangles mark the genes that have been reversed (light green), transposed (brown), and reverse transposed (dark green).