
Figures & data
Figure 1. Final structural model.
Note. Dashed line indicates path was not significant at the .05 level. For illustrative purposes, each of the three stages is bounded by the paths (rather than constructs) contained within the respective stage; for example, Ideology moderates Plan → Policymakers is considered a Stage 2 outcome because the path is drawn within the Stage 2 boundaries. Omitted from this final structural model is TeamID, which was predicted to moderate the relationship between Plan and Consume (H3b) but was removed from analysis because of suspected multicollinearity with Consume; *p < .01. **p < .001.
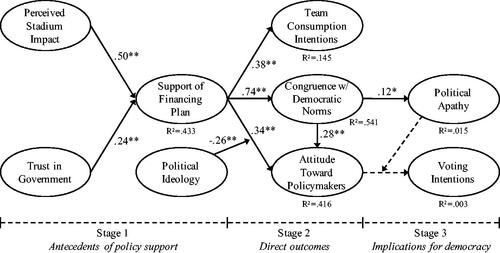
Table 1. Demographic comparison of sample, county registered voters, and all county residents.
Table 2. Measurement model using split-half sample (n = 200).
Table 3. Comparison of AVE and squared correlations.
Table 4. Summary of hypothesis testing.
Table 5. Descriptive statistics.