Figures & data
. Abras de Mantequilla wetland, location in Ecuador and Guayas River Basin. Right figure WETwin project database (Arias-Hidalgo, Citation2012).
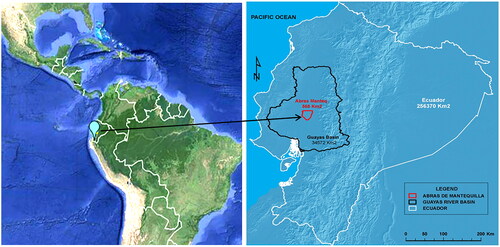
Figure 2. (a) Fauna at Abras de Mantequilla wetland during the wet season, and (b) Abras de Mantequilla wetland at “El Recuerdo”, same location during the dry season (left) and wet season (right).
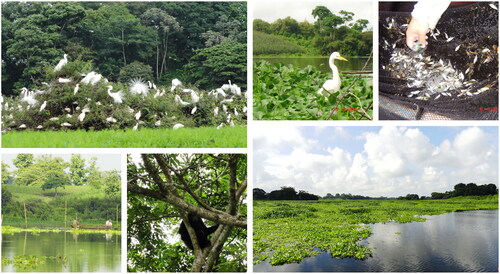
Figure 3. Digital Elevation Map at the Guayas River Basin Scale. Guayas River Basin (area with yellow line), Chojampe subbasin (area with red line). White arrows indicate flow directions. Source (Arias-Hidalgo, Citation2012).
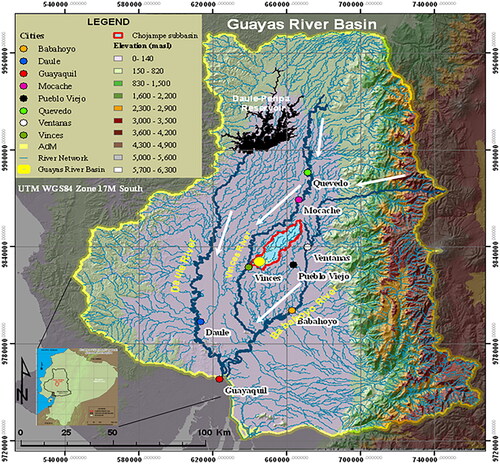
Figure 4. Digital Elevation Map at the AdM wetland scale. Source (Arias-Hidalgo, Citation2012).
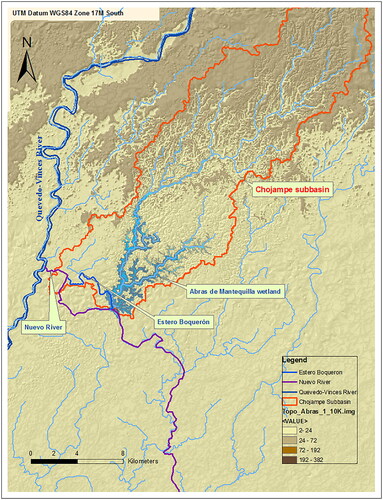
Figure 5. Measuring stations near the Abras de Mantequilla wetland: (i) Pichilingue (North of the Basin) (ii) Pueblo Viejo (East of Abanico subbasin); and (iii) Vinces (Near the confluence of Vinces and Nuevo River).
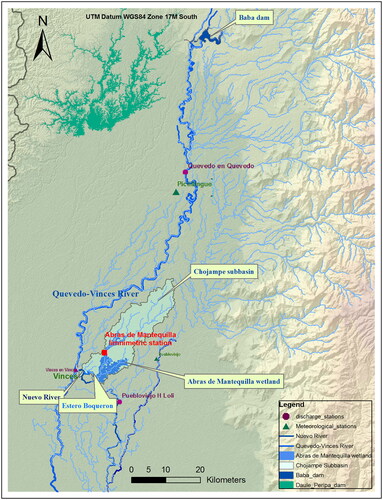
Figure 6. Annual precipitation at Pichilingue station (period 1963–2012).
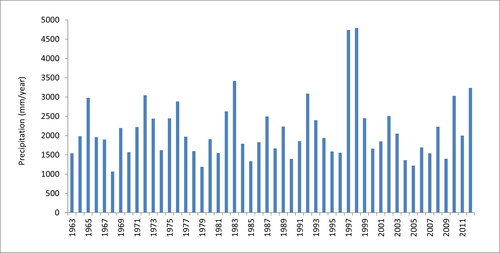
Figure 7. Minimum, Maximum and Average monthly precipitation in Pichilingue station (1962–2012).
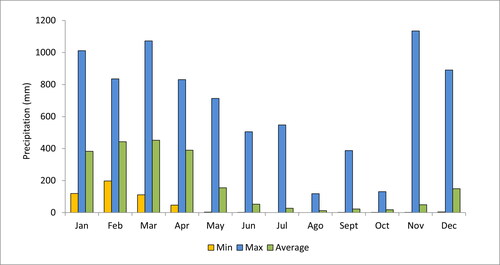
Table 1. Discharge and water level data.
Figure 8. Monthly discharges in (a) Quevedo en Quevedo, and (b) Vinces en Vinces stations. Period (1964–2010).
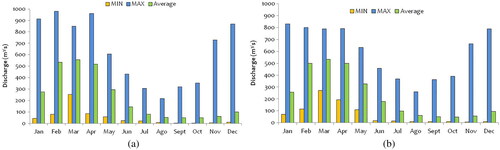
Figure 9. Monthly water levels in Abras de Mantequilla limnimetric station (1988–2007).
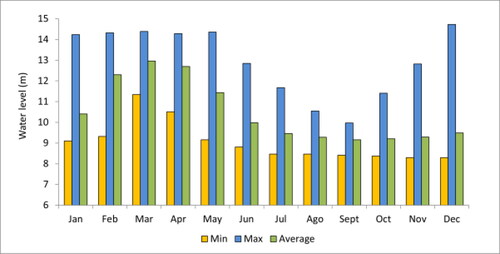
Figure 10. Chojampe micro-basins and tributaries to the Abras de Mantequilla wetland (Galecio Citation2013).
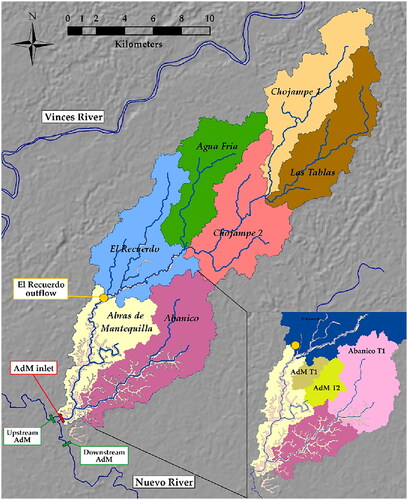
Figure 11. Abras de Mantequilla wetland grid; boundary conditions (red lines): Upstream AdM (Nuevo river: main inflow to the wetland); Upper Chojampe (El Recuerdo, AdM T1, AdM T2, Abanico T1); Downstream AdM (wetland outflow). Observation points (white dots), located at upper (S1), middle (S2, Abanico F), low (S7, S3c) wetland areas. Source: (Galecio Citation2013).
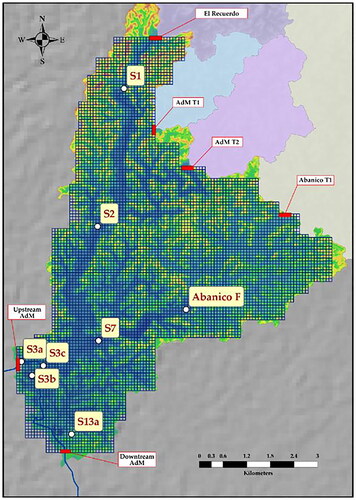
Figure 12. Abras de Mantequilla wetland (AdM) - main inflows and Hydrodynamic model schematization. Left panel: “El Recuerdo” (yellow dot) collects the run off of the five contributing microbasins from Upper Chojampe Sub-basin (Chojampe 1, Las Tablas, Chojampe 2, Agua Fria and El Recuerdo). Abras de Mantequilla wetland area (in light yellow). Right panel: Hydrodynamic model schematization - Abras de Mantequilla wetland grid (from Delft3D-FLOW). Boundary conditions (in red lines). Low boundary condition (Upstream AdM) represents the main inflow to the wetland “The Nuevo River-Estero Boquerón.” Upper boundary conditions (El Recuerdo, AdM T1, AdM T2 and Abanico T1). Source (Galecio Citation2013).
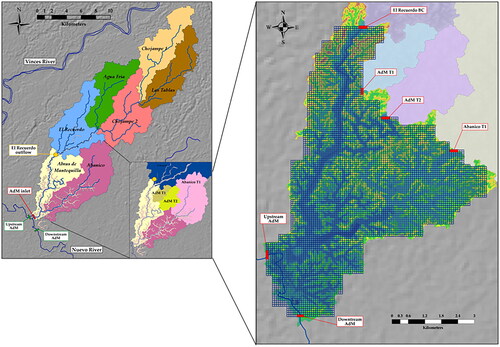
Figure 13. Simulated and measured water levels at Abras de Mantequilla limnimetric station “El Recuerdo” for the average year (2006).
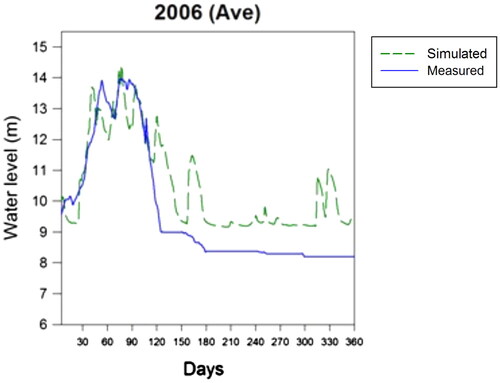
Figure 14. Simulated and measured water levels at Abras de Mantequilla limnimetric station “El Recuerdo”. For: dry year (1990), wet year (1992), and extreme wet year (El Niño-1998). X axis represents a calendar year from January to December (in days).
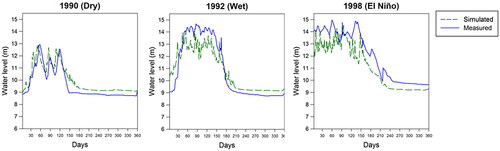
Table 2. Model performance for the different years.
Table 3. Simulated water depths results (m) of observations points located at the upper, middle, and lower wetland areas, for the different conditions.
Figure 15. Water depth (m) maps (January-March) first trimester of the year. February-March are mostly the peak months of the wet season. For: dry year (1990), extreme wet year (El Niño-1998), and average year (2006). Scale bar indicates the water depth range (m).
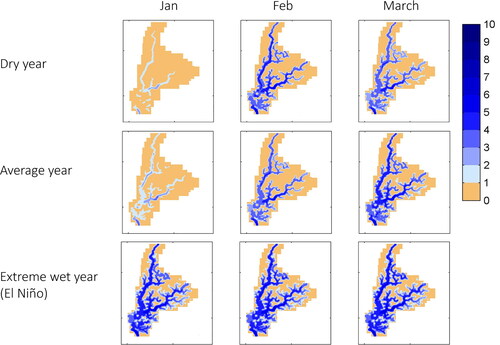
Figure 16. Water depth (m) maps (April-June), June is considered as transition month to the dry season. For: dry year (1990), extreme wet year (El Niño-1998), and average year (2006). Scale bar indicates the water depth range (m).
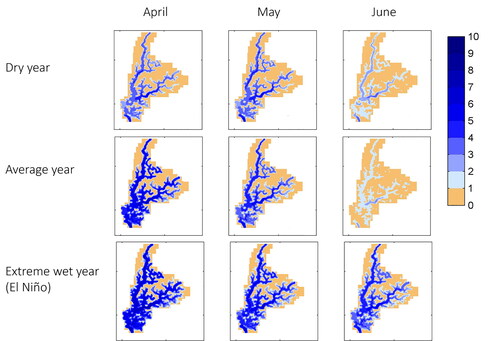
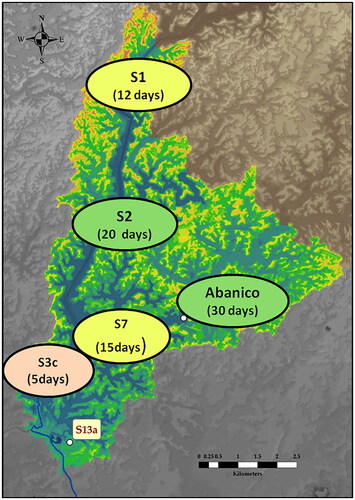
Table 4. Residence time (days), at upper, middle and low wetland observation points.
Figure 17. Stage-volume curve for Abras de Mantequilla wetland.
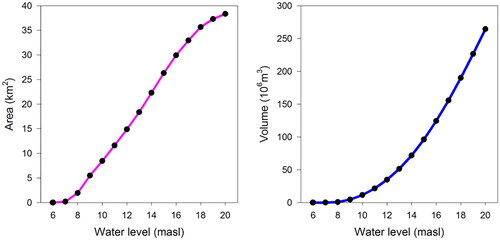
Figure 18. Boxplot of wetland inundation area (km2). Built with a stage volume curve and Delft3D-FLOW simulations results (one year simulation), from: dry year (1990) and extreme wet year (El Niño-1998). Each month built with the daily values of each simulation. Blue line (mean). Upper and lower black dots show the 5th and 95th percentiles. Months display from left to right: January (1), to December (12).
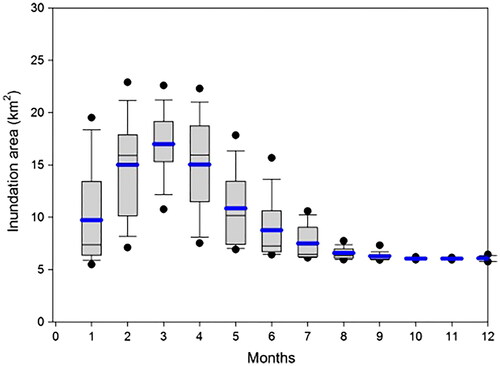
Figure 19. Relative importance (%) of inflows in AdM for the different conditions/years simulated. In blue box: El Recuerdo and Chojampe small tributaries.
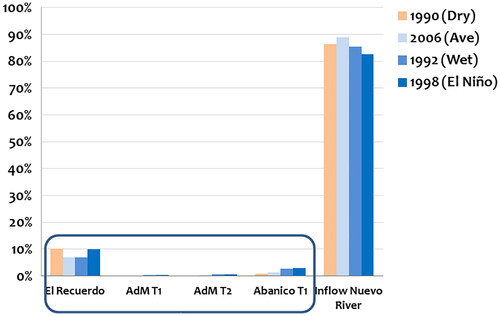
Figure 20. Conservative TRACERS transport at the two main inflows of AdM. Upper panel: El Recuerdo inflow; Lowe panel: Nuevo River inflow. One snapshot per month (Snapshots only for wet season).
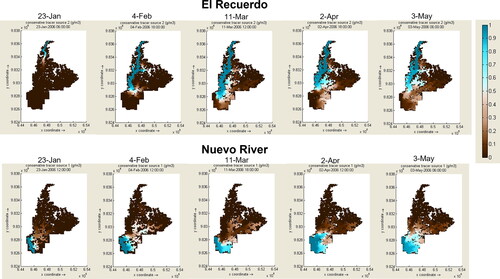
Figure 21. Residence time (days), at upper, middle and low observation points. Values represented correspond to the average values from .