Figures & data
Figure 1. Different wake overlap states, from full overlap to no overlap, for spacing (Sc) to diameter (D) ratios ranging from less than 1.2 to greater than 4 (Nicolle Citation2009).
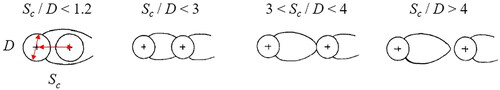
Figure 2. (a) Plan and (b) section of the experimental setup used to quantify passage of roach (Rutilus rutilus) at a model gauging weir with CBC array installed. The weir and extent of the experimental area are shown (dimensions in mm).
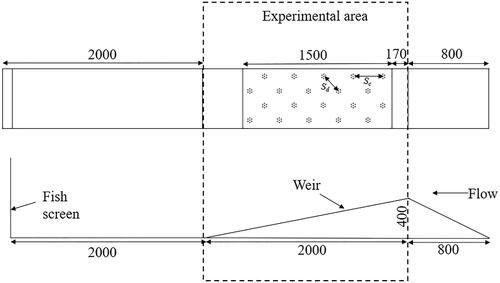
Table 1. Configurations tested during experimentation and their diameters (D), diagonal spacings (Sd), slope (So), temperature (T), average water depth (y), velocity (V) and Froude number (Fr), percentage of “low” velocity area within the array (% LVA) and lateral spacing (c/c)/diameter ratio (Sc/D).
Figure 3. Representative (Intermediate D—High Sd treatment) water velocity profile (m s−1) within a CBC array from the crest (0) to the top of the hydraulic jump. Flow direction is denoted by the black arrow, while black dots and purple crosses indicate locations of the clusters (not actual size) and velocity measurements, respectively. The colour map was created by interpolating between these points.
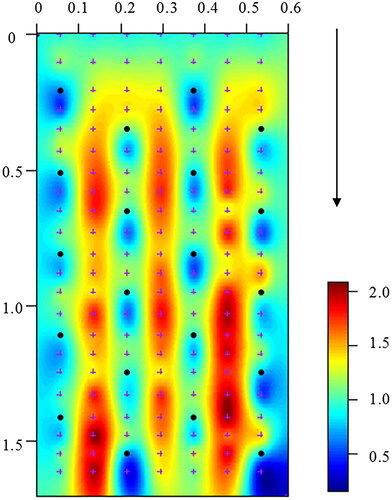
Table 2. Metrics used to determine the influence of cluster spacing and diameter, and thus wake width and length, on passage efficiency and swimming behaviour of roach (Rutilus rutilus) when navigating through CBC arrays installed on an experimental sloped weir.
Figure 4. Passage efficiency for each treatment tested is depicted, where passage efficiency is quantified as the number of roach that successfully passed an experimental gauging weir, expressed as a percentage of those that attempted for different array arrangements. The six alternative treatments based on characteristics of a CBC array, are High D—Low Sd (HDLS), Intermediate D—Low Sd (IDLS), Low D—Low Sd (LDLS), High D—High Sd (HDHS), Intermediate D—High Sd (IDHS), Low D—High Sd (LDHS). Sd is the diagonal spacing between clusters, Sc is the lateral spacing between clusters (c/c) and D is cluster diameter in metres. The dashed diagonal line depicts the trend line between passage efficiency and the spacing to diameter ratio.
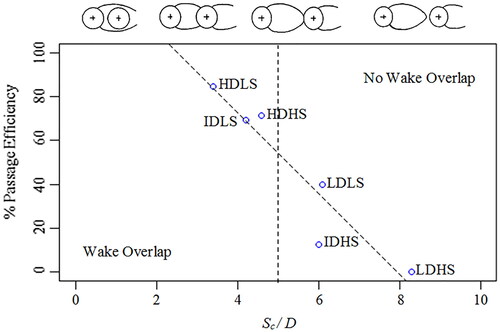
Table 3. Numbers of roach that attempted, passed and failed, and corresponding passage efficiency for each of the treatments tested.
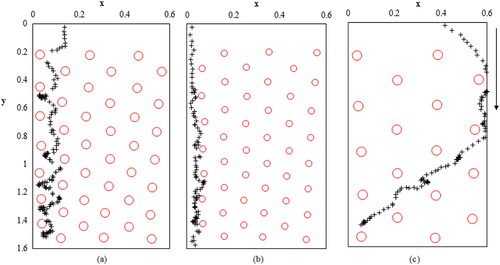
Figure 5. Examples of swim paths exhibited by roach as they ascended an experimental gauging weir with CBCs installed on the face. The crosses indicate swimming behaviour paths for zigzagging (a) wall association (b) and combination including lateral traversing (c). The arrow indicates the direction of flow.