Figures & data
Figure 1. a) Location of the study sites; b) Nog 1, c) Nog 2, d) Nog Mon, with positions of cross-sections, quadrats (black squares) and crest-stage recorders (X) marked on DEMs derived from ground surveys.
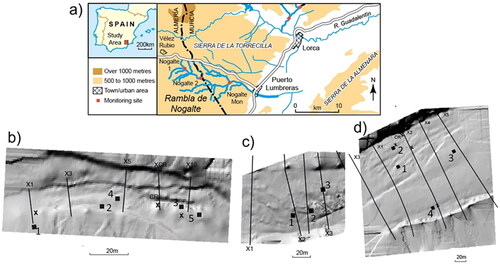
Figure 2. Stage levels measured on the Nogalte site NogMon, 1997–2020.
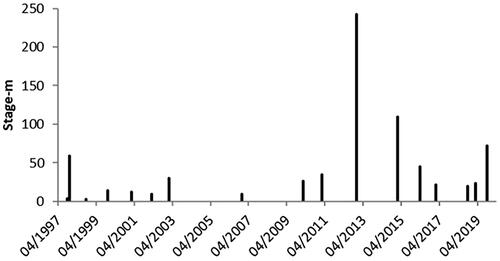
Figure 3. Photographs of a) mature Retama, b) damaged Retama with large sediment in the base as a result of the 2012 flood, c) remains of Retama, but with some sprouting and seedlings, d) Sprouting of Retama at NogMon site.
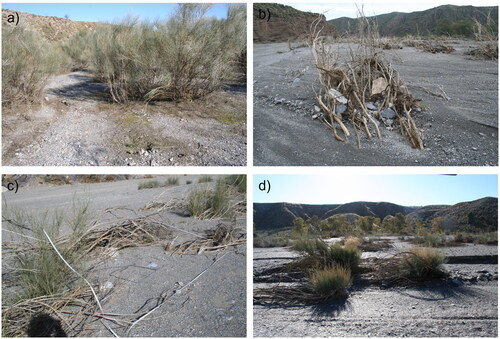
Figure 4. Values of velocity and discharge for range of values of Manning n 0.03–0.07, using pre-flood morphology at surveyed cross-sections in each site with most probable values selected.
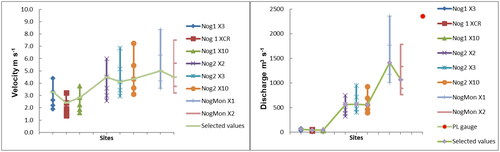
Table 1. Calculated most probable hydraulic parameters in each reach for pre-flood vegetated state and post-flood minimal vegetated state, using pre- and post-flood morphology, respectively, and for post-flood morphology with vegetated (regrowth) state.
Figure 5. Representative cross-section profiles at each site surveyed before and after the 2012 flood, showing the morphological changes.
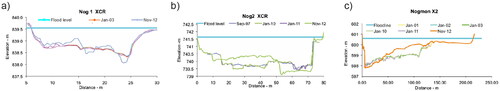
Figure 6. Nog Mon reach in 2010 (pre-flood), November 2012 (immediate post -flood) and 2019 (after regrowth).
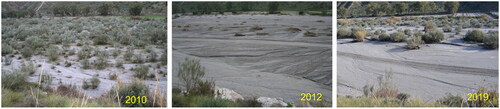
Figure 7. Comparison of example quadrats pre-flood (top row), post-flood (middle row) and in 2020 (bottom row) at Nog 1(left), Nog 2 (middle) and Nog Mon (right).
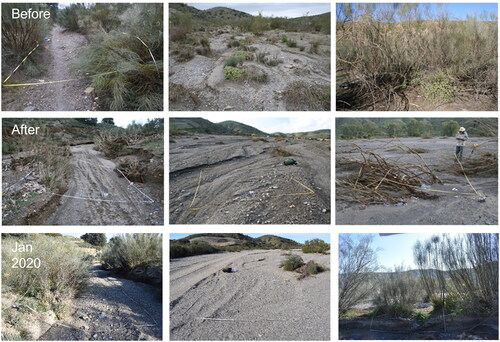
Figure 8. Changes in % vegetation cover, January 2012 (pre-flood) to January 2020, a) Nog 1, b) Nog 2, c) Nog Mon and peak flow occurrence. VQ = Vegetation Quadrat (as numbered on ).
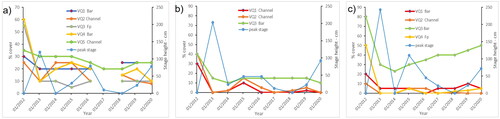
Figure 9. Changes in maximum height of plants, January 2012 (pre-flood) to January 2020, a) Nog 1, b) Nog 2, c) Nog Mon and peak flow occurrence.
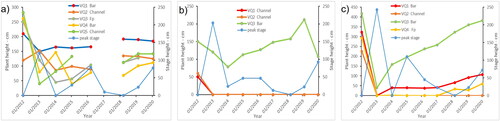
Figure 10. Values of shear stress calculated for sub-zones within cross-sections for different effects on the plants of the 2012 peak flow, a) Retama, b) Retama, shrubs and herbs.
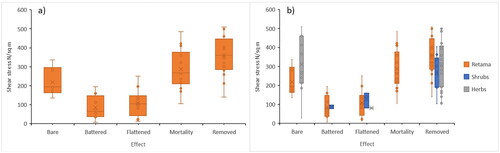
Figure 11. Changes in state of plants in vegetation groups, Retama, shrubs and herbs, recorded on each vegetation quadrat in the three study sites in the period January 2012-January 2020.
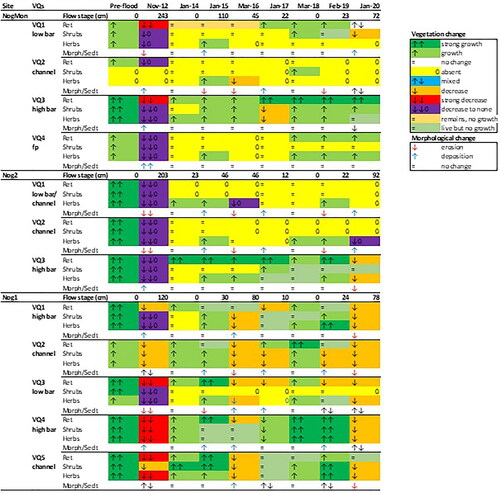
Table 2. Measurements of % cover and maximum regrowth, 2012–2020, grouped by positions of quadrats.
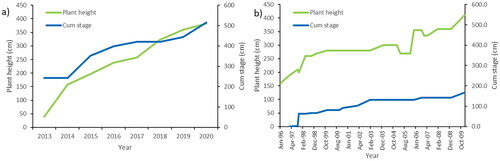
Figure 12. Growth in a Retama plant on one vegetation quadrat at site NogMon in relation to cumulative amounts of flow as measured by peak stage recorder at the site, a) 2012–2020, b) June 1996–January 2010 (after Hooke and Mant Citation2015).