Figures & data
Figure 1. Location of the study site with an overview of Saxony river systems and Mortelbach within the city of Waldheim showing the four 4 restored river sections (D1, M1, D2, and M2, downstream to upstream) with structural measures such as pools, riffles, and riparian/aquatic vegetation.
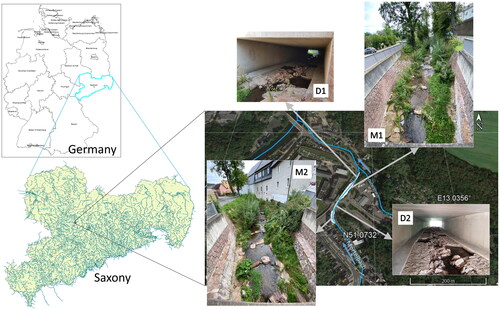
Table 1. Fuzzy sets of habitat variables and their descriptions
Table 2. Examples of fuzzy rules determining habitat requirement for A. fluviatilis
Figure 2. Spatial distribution of water depth, velocity, and temperature before restoration (a) and afterrestoration (b) at MALF = 0.041 m3/s.
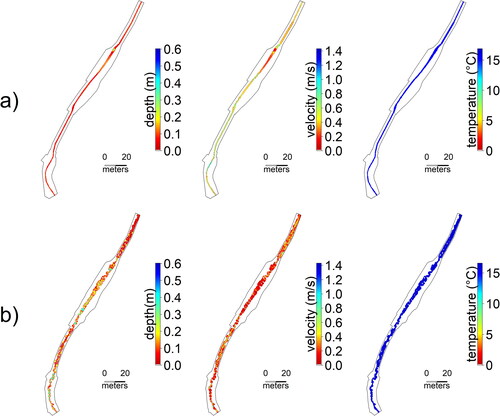
Figure 3. An example of the spatial distribution of velocity vectors showing changes in flow field due to instream structures in Section M1 before restoration (a) and after restoration (b) at MALF = 0.041 m3/s.
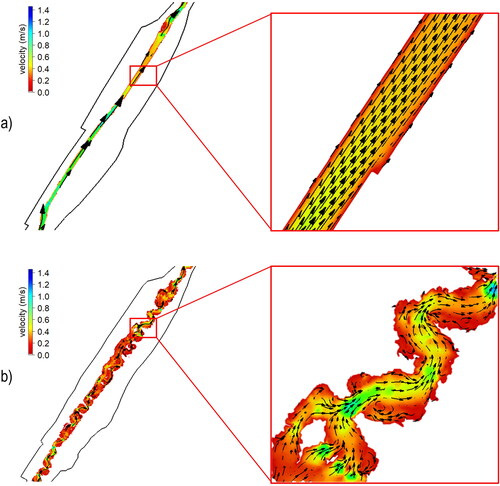
Figure 4. Frequency distribution of water depths and velocities before restoration and after restoration at MALF = 0.041 m3/s.
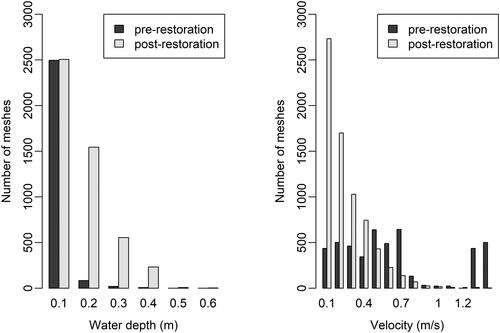
Figure 5. Box plots comparing different habitat suitability index classes for three target taxa with discharge classes at the river site. < MALF: 0.02–0.041 m3/s; MALF–MAF: 0.041–0.1 m3/s; > MAF: 0.1–0.93 m3/s. pre and post denote pre- and post-restoration, respectively.
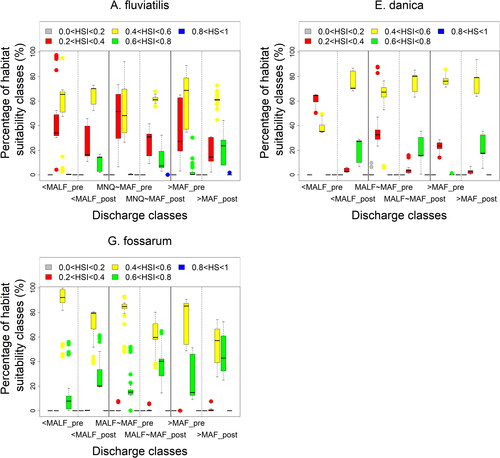
Figure 6. Habitat areas of Mortelbach with different suitability classes during the study period from spring to summer 2021 for three species of macrozoobenthos with (_post) and without (_pre) restoration measures.
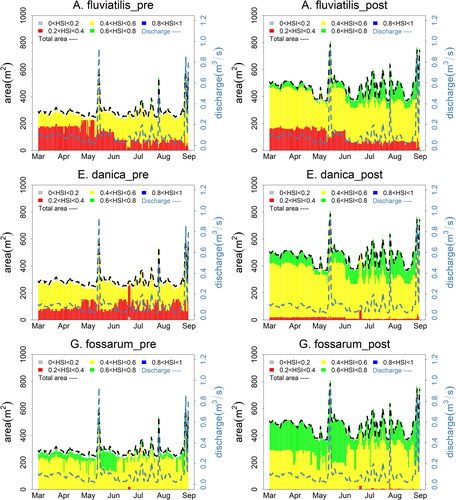
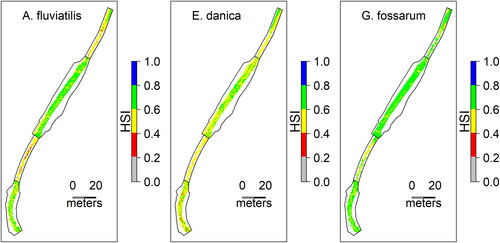
Figure 7. Habitat Suitability Index map for a) A. fluviatilis; b) E. danica; c) G. fossarum at the minimum discharge (0.02 m3/s) on two different days at the current situation (different restoration measures in D1, M1, D2, and M2). The colour represents each habitat suitability index class (grey: 0< HSI ≤0.2; red: 0.2< HSI ≤0.4; yellow: 0.4< HSI ≤0.6; green: 0< HSI ≤ 0.8; blue: 0.8< HSI ≤1).
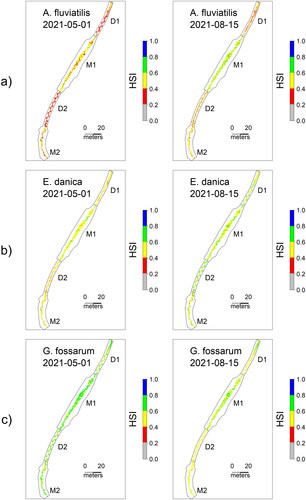
Figure 8. Habitat Suitability Index map for three target species showing the post-restoration situation in summer at the discharge of 0.85 m3/s. The colour represents each habitat suitability index class (grey: 0< HSI ≤0.2; red: 0.2< HSI ≤0.4; yellow: 0.4< HSI ≤0.6; green: 0< HSI ≤ 0.8; blue: 0.8< HSI ≤1).