
Figures & data
Figure 1. Examples of detected clusters by each algorithm: Proposed (Top), Circular-scan (Bottom left), and Flex-scan (Bottom right).
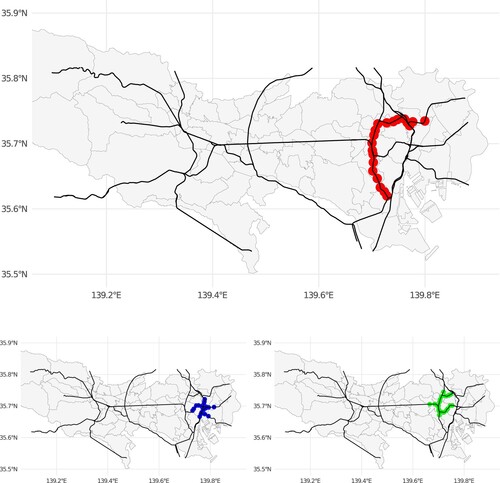
Figure 2. JR network in Tokyo: black line is JR railway line, and gray circle is 800-m ball centered at each station.
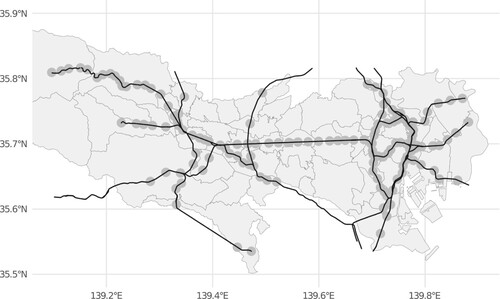
Table 1. Number of potential clusters created in each algorithm.
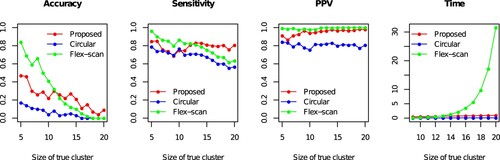
Figure 3. Simulation results: Accuracy, Sensitivity, Positive predicted value (PPV) and calculation time (second) of proposed (PTNS), Circular-, and Flex-scan approaches.
Data availability statement
In this study, we do not use real data.