
Figures & data
Figure 1. Base case designs solution of the East-West Link (Eastern Section), not including ancillary upgrades or the extension to the port. Central Melbourne is at the bottom centre of the map (Department of Transport Citation2013, 89). © State of Victoria, under the Creative Commons Attribution 4.0 Licence http://creativecommons.org/licenses/by/4.0/
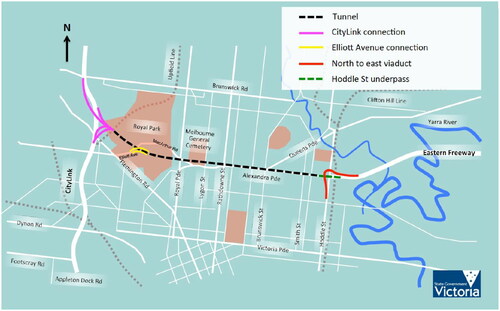
Table 1. Key documents problematising the East-West Tunnel.Footnote3
Table 2. Key informants interviewed in this study.
Figure 2. The geographically constrained study area of the Northern Central City Corridor Strategy Draft (Department of Infrastructure Citation2003, 2). © State of Victoria, under the Creative Commons Attribution 4.0 Licence http://creativecommons.org/licenses/by/4.0/
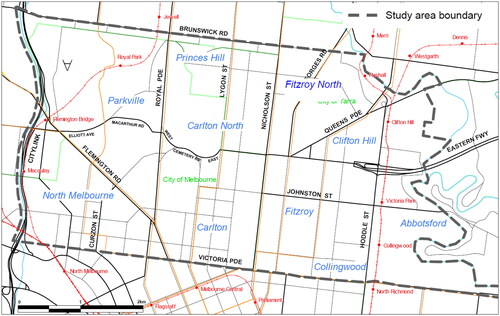
Figure 3. Lines on a map: selective representation of the major roads of Melbourne. Arterials/freeways are black, circumferential roads blue, and network ‘gaps’ red (Department of Transport Citation2013, 35). © State of Victoria, under the Creative Commons Attribution 4.0 Licence http://creativecommons.org/licenses/by/4.0/
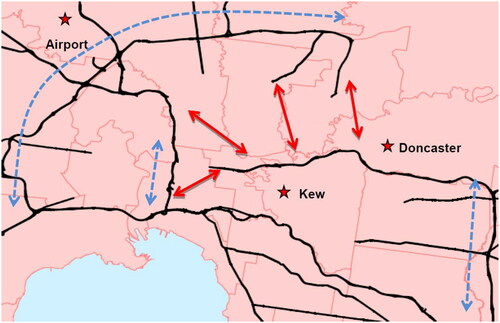
Table 3. Comparison of the different modes of benefit-cost analysis on some of the EWT iterations (Eddington Citation2008; Department of Transport Citation2013).