
Figures & data
Figure 1. The global infrastructure gap and a strategy to address it.
Source: WEF (Citation2014, 15).
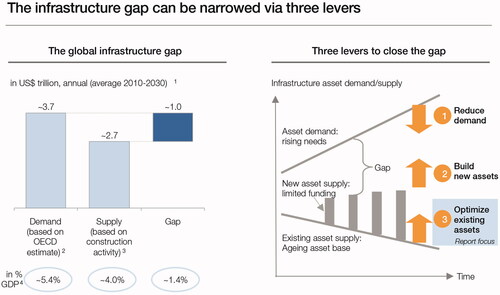
Table 1. Lessons from the OMEGA Centre Case Studies of 30 MTPs.
Figure 2. The three horizons of growth concept.
Source: Baghai, Coley, and White (Citation1999, 5).
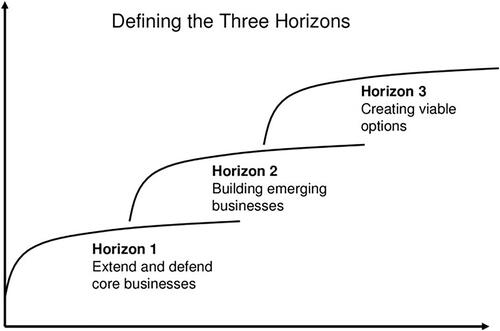
Figure 3. The global risks landscape, 2007–2020.
Source: WEF (Citation2019, 5)
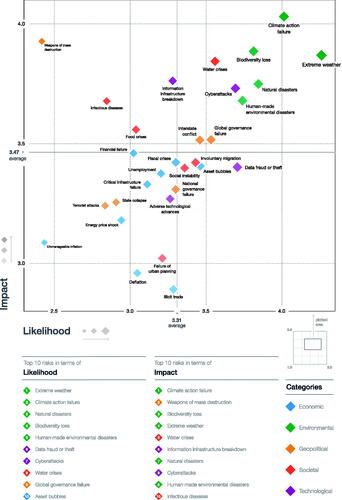
Figure 4. The belt and road initiative.
Source: Merics (Citation2018)
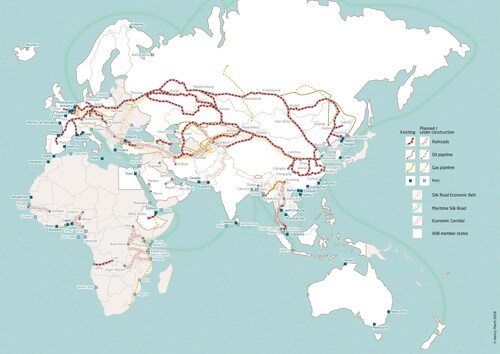
Figure 5. The Trans-European transport networks programme.
Source: European Commission (2013).
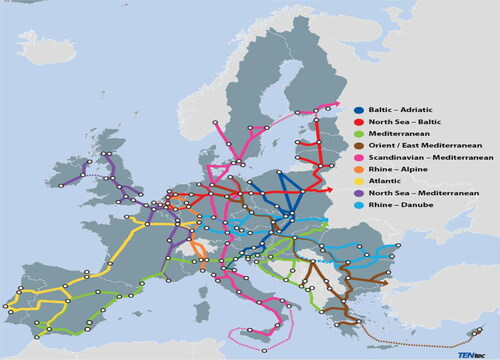
Table 2. Notable sovereign wealth funds investing in infrastructure.