
Figures & data
Figure 1. Modeling framework.
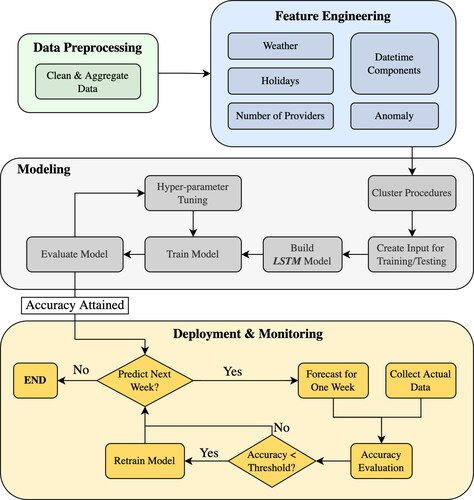
Figure 2. Data associated with the primary providers and services provided. Distribution of the (i) primary providers based on years of service; (ii) unique services per provider; (iii) number of surgical procedures by service during May 2014 to September 2021 (data of 2020 is excluded).
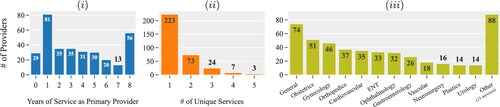
Figure 3. Heat map of ten procedures that were not scheduled after December 2018.
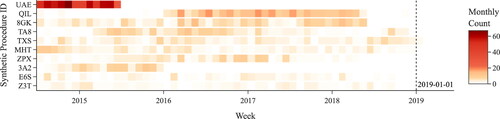
Figure 4. Distribution of the volume of surgical cases based on (i) day of the week, (ii) week of year, (iii) month of the year, and (iv) total number per year.
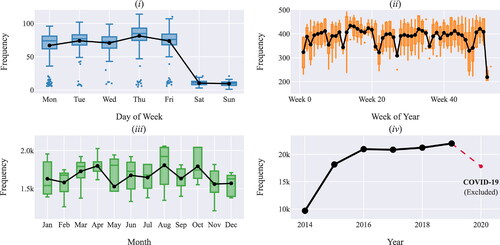
Figure 5. (i) Distribution of the volume of surgical cases during a regular day, Federal holidays, and weekend. (ii - iv) The volume of surgical cases several business days prior and proceeding three major holidays.
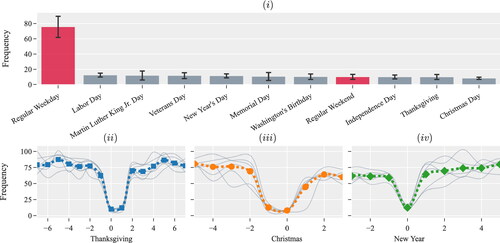
Figure 6. (i) Snapshot and (ii) timeline show the relationship between the number of primary providers and the number of times procedure XJS was scheduled per week.
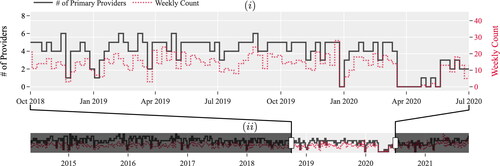
Figure 7. (i) Anomaly scores per observation of procedure XJS. (ii) Distribution of the anomaly score. (iii) A time series of the procedure with the corresponding anomalies.
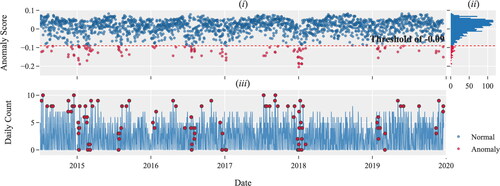
Figure 8. Distribution of surgical procedures based on the total number of observations during the period of study. (i) Procedures with more than 800 observations; and (ii) Procedures with less than 800 observations.
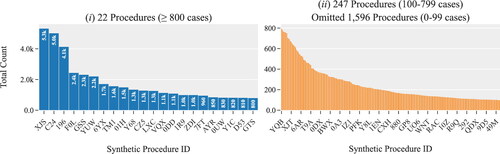
Table 1. Performance evaluation.
Figure 9. Predictions for procedure XJS.
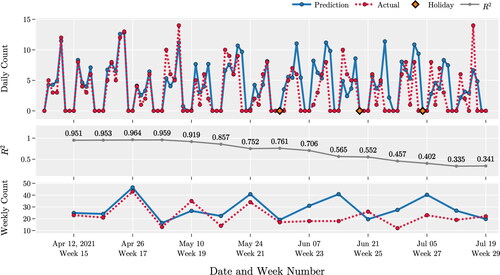
Figure 10. Distribution of the residuals for procedure XJS.
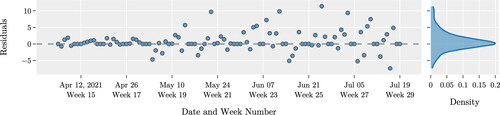
Table 2. Summary of model performance.
Figure 11. Predictions of the largest cluster of procedures, C1.
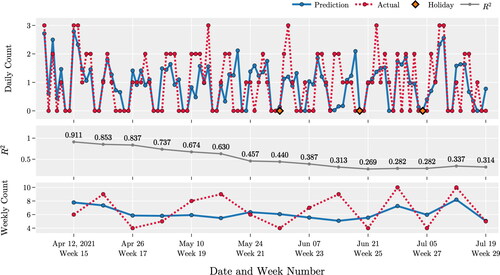
Figure 12. Results of model deployment and monitoring for procedure XJS.
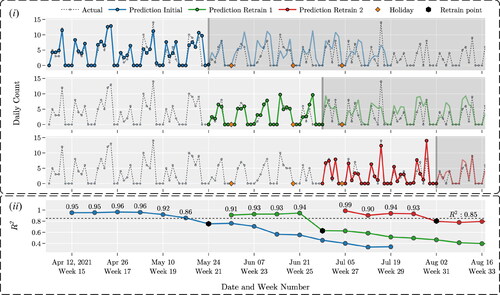
Table A1. Description of columns in the dataset.
Table A2. Description of features used in the forecasting model.