
Figures & data
Table 1. Share (%) of bus drivers from study and comparison companies answering different questions on mobile phone use while driving (n indicates the number answering each question).
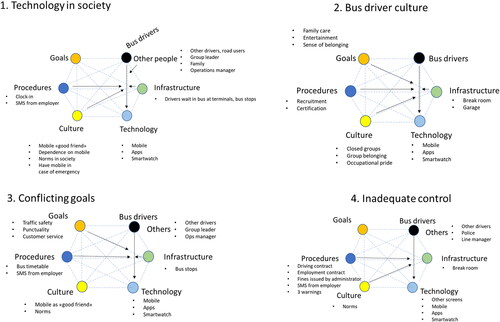
Figure 1. Main themes describing sociotechnical interactions supporting the use of technology (mobile phones) by bus drivers while driving.
Supplemental material