
Figures & data
Figure 1. Intervention procedure (step one and step two), and the three measurements (baseline, follow-up one and follow-up two), which were completed in both the intervention and control group.
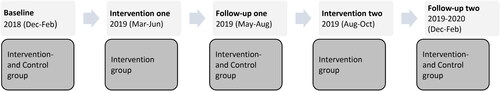
Figure 2. Flowchart describing the procedure in step one (education) and step two (workshops) of the intervention.
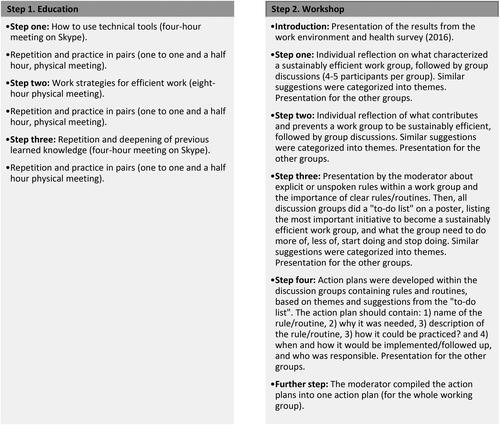
Table 1. Background characteristics and outcome variables for the intervention and control group at baseline (i.e., ICT use outside regular working hours, productivity, expectations of availability, and clarity of expectations about availability).
Figure 3. Flowchart of participants through the study and numbers analyzed after application of inclusion criteria (respond to baseline questionnaire and at least one follow-up).
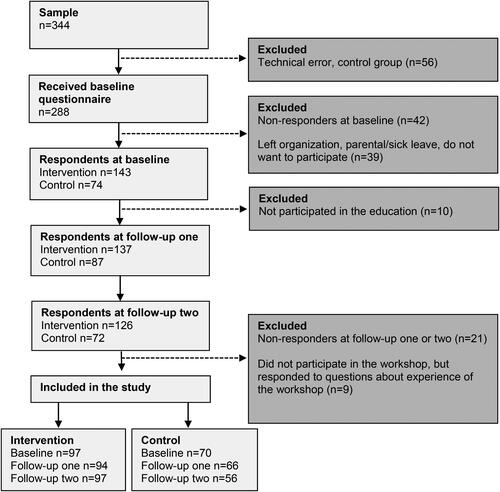
Table 2. Employees’ experience of the intervention, measured about 2 months after the education (follow-up one) and about 4 months after the workshop (follow-up two).
Table 3. Descriptive statistics describing the change in work strategies after the education (follow-up one) and workshop (follow-up two), presented as the mean change (SD) for the intervention and control group.
Table 4. ICT use outside regular working hours, perceived productivity, expectations of availability, and clarity of expectations about availability at baseline, follow-up one and follow-up two, presented as mean (SD) for the intervention and control groups.
Table 5. Effects of the intervention on changes in ICT use outside regular working hours, perceived productivity, expectations of availability, and clarity of expectations about availability at follow-up one and two.