
Figures & data
Figure 1. A worker wearing the BackX-S v3.0 (from the frontal and sagittal plane, respectively). Chest and knee pads, and springs are illustrated. Additionally, the directions of actuation of the springs are indicated by blue arrows.
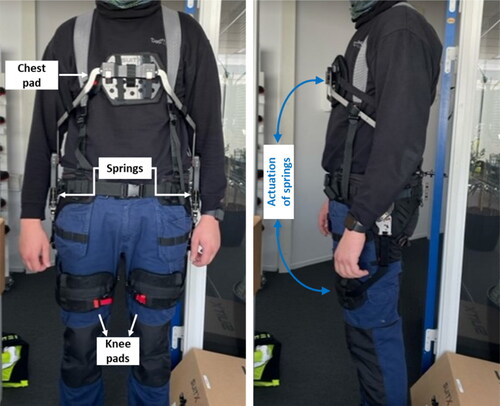
Table 1. Training protocol.
Figure 2. Snapshots of a worker lifting a box from a shelf (height = 15 cm) to a truck (height = 100 cm) during one of the test sessions wearing the measurement hardware (surface electromyography and kinematics assessments) and the passive back exoskeleton. The figure illustrates the movement of the task chronologically from left to right.
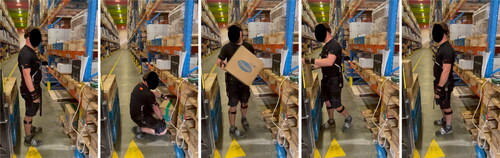
Table 2. Descriptions of the work tasks in the test sessions. Specification of the items (mass and dimensions).
Figure 3. Mean and individual self-reported PBE use during the 5-week training period (n = 9). Additionally, the intended use stated in the training protocol is included.
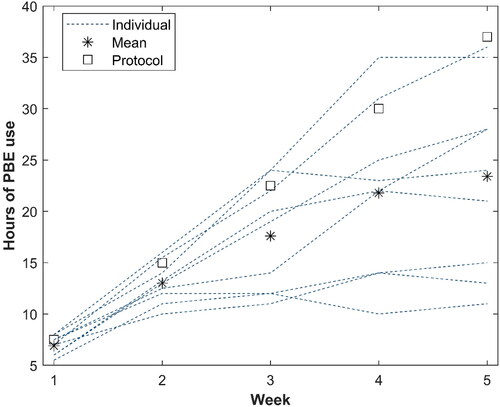
Figure 4. Mean and individual values of the 90th–10th percentile difference in SEMG amplitude of left/right erector spinae and lower trapezius during noEXO/EXO conditions (n = 19). *Indicates significant differences (α <.05).
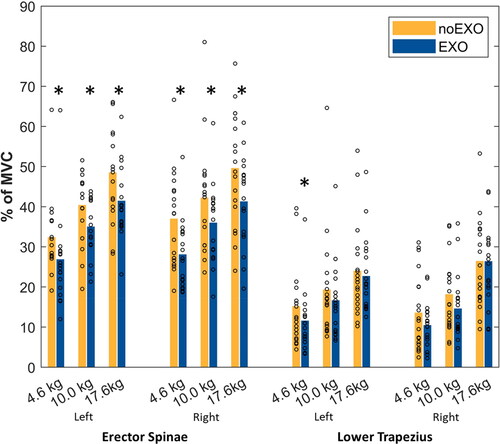
Figure 5. Mean and individual values of the 90th–10th percentile difference in SEMG amplitude of left/right erector spinae and lower trapezius of CON (n = 10) and INT (n = 9) group during EXO condition from the pre/post-tests. *Indicates significant differences (α <.05).
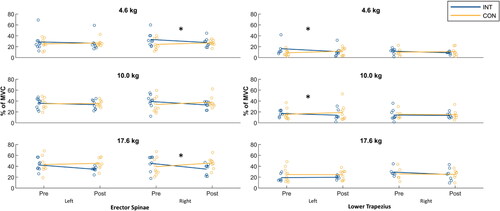
Figure 6. Mean and individual values of the 90th–10th percentile difference in joint angles of trunk bending, rotation, and left/right knee and shoulder flexion/extension during noEXO/EXO conditions (n = 19). *Indicates significant differences (α <.05).
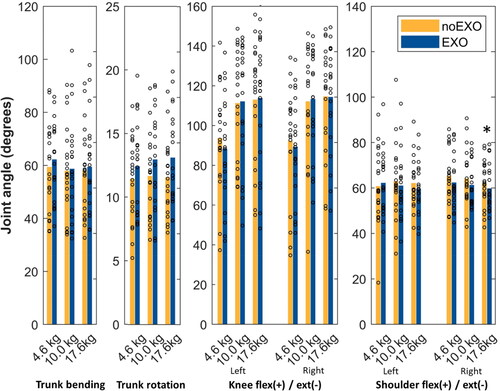
Figure 7. Mean and individual values of the 90th–10th percentile difference in joint angles of trunk bending and rotation, left/right knee, and shoulder flexion/extension of CON (n = 10) and INT (n = 9) group during EXO condition from the pre/post-tests. *Indicates significant differences (α <.05).
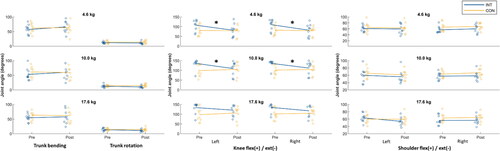
Figure 8. A: Mean and individual values of the rated perceived exertion (RPE) during noEXO/EXO conditions (n = 19). *Indicates significant differences (α <.05). B: Mean and individual values of the rated perceived exertion (RPE) of CON (n = 10) and INT (n = 9) group during EXO condition from the pre/post-tests. *Indicates significant differences (α <.05).
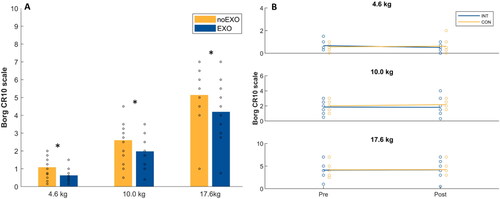
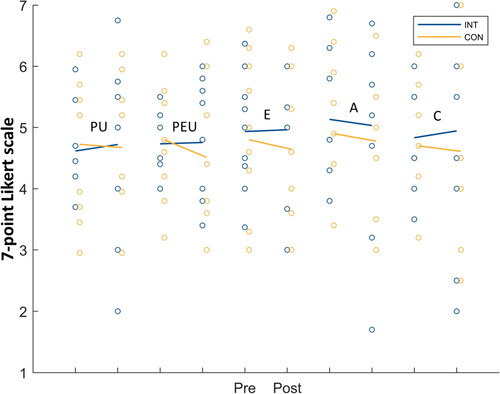
Figure 9. Mean and individual values of the Questionnaire for the Evaluation of Physical Assistive Devices (QUEAD) Likert-scale ratings. Pre/Post training ratings of perceived usefulness (PU), perceived ease of use (PEU), emotions (E), attitude (A), and comfort (C), are included for the intervention (INT, n = 9) and control group (CON, n = 10).
Supplemental Material
Download PDF (1.4 MB)Data Availability Statement
The data that support the findings of this study are available from the corresponding author upon reasonable request.