Figures & data
Figure 1. Comparison of (a) batch and (b) milkrun picking.
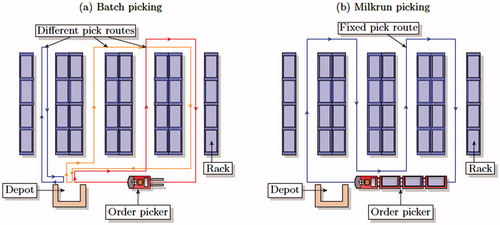
Figure 2. Overview of the milkrun picking system.
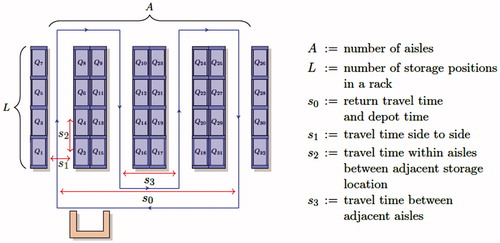
Figure 3. Description of dj,n.
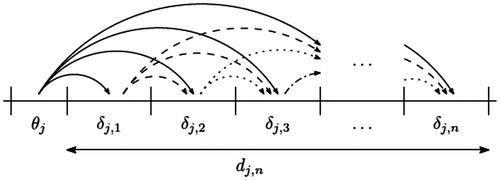
Figure 4. Example of the partially matched crossover operator.
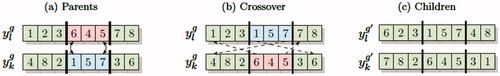
Figure 5. Example of the edge recombination crossover.
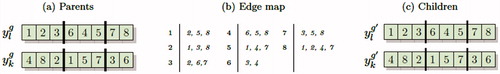
Table 1. Parameters of the system instances test set.
Table 2. Parameters used in the GA.
Table 3. Solution quality and accuracy of the GA on the test set.
Table 4. The conditional probabilities, σij, that product i (row) and product j (column) are picked for a customer order.
Table 5. For picking strategy exhaustive (EX), globally-gated (GG), and locally-gated (LG), the fraction of times this strategy achieves the minimal mean order throughput time given system load ρ, traveling time s, and picking time b.
Table 6 For picking strategy exhaustive (EX), globally-gated (GG), and locally-gated (LG), the average percentual improvement in mean order throughput time given the strategies, system load ρ, traveling time s, and picking time b.
Table 7. Parameters of the China online shopping warehouse.
Figure 6. Expected demand distribution China online shopping warehouse.
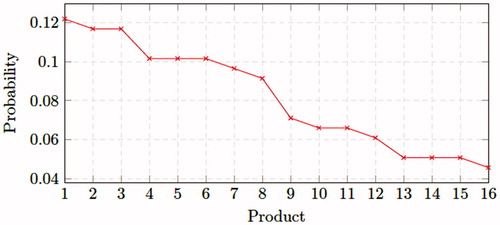
Figure 7. Results for China online shopping warehouse for different utilization ρ and the three picking strategies.
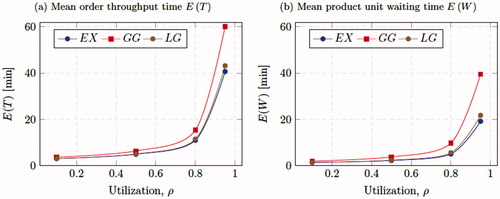
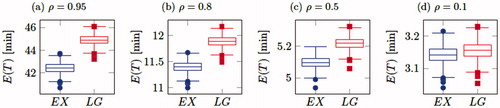
Figure 8. Box plots of mean order throughput times for 3000 different product allocations for various values of the utilization ρ.