
Figures & data
Figure 1. Past and forecasted poultry consumption per year for selected regions (OECD, Citation2017)
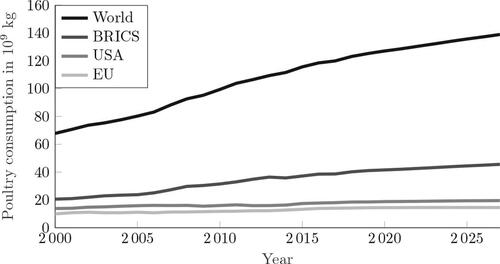
Figure 2. The batcher considered in this article.
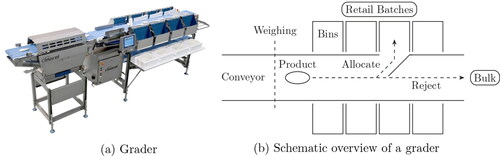
Figure 3. Maximum and minimum indexes per bin level v.
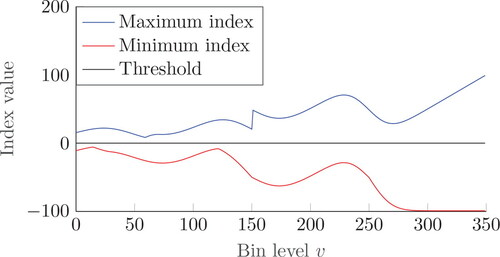
Figure 4. Throughput after N items.
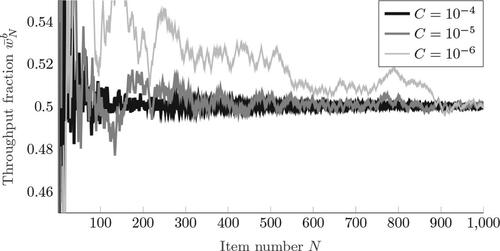
Figure 5. Value of threshold after N items.
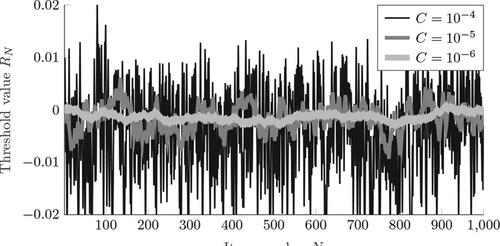
Figure 6. Sensitivity of various policies to C.
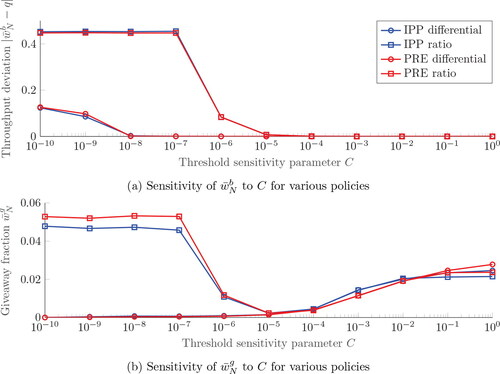
Figure 7. Optimal action per state for K = 1, B = 350, and
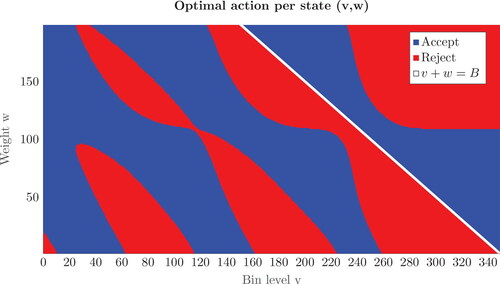
Figure 8. Revenue per gram for and B = 30 (left) and 35 (right).
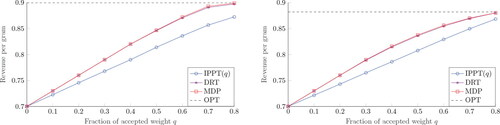
Figure 9. Revenue per gram for and B = 30 (left) and 35 (right).
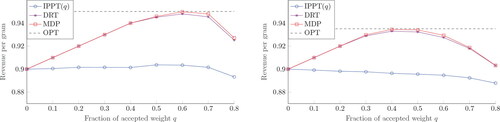
Figure 10. Revenue per gram for the benchmark and DRT for B = 300 and 350.
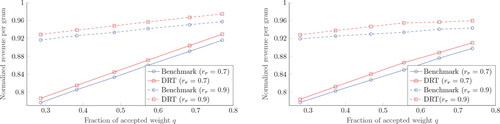
Figure 11. Giveaway per gram for different target weights.
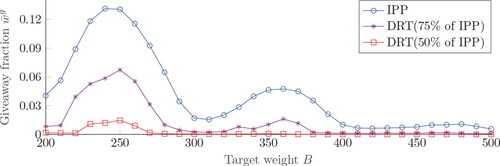
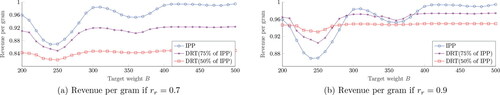
Figure 12. Revenue per gram for different target throughputs.
Supplemental material