
Figures & data
Figure 1. A sample path of the inventory level/inventory position for the policy with S = 10, r = 3, q = 5 and T = 2.
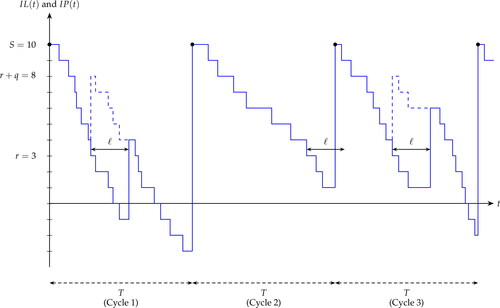
Table 1. Optimal policies with fixed period length T = 7,
λ = 5, h = 1, co = 5 and ce = 5.
Table 2. Optimal policies
λ = 5, h = 1, co = 5 and ce = 5.
Table 3. Stock-based policies when T = 14 for (a) single and (b) multiple emergency shipment opportunities.
Table 4. Comparison of the policy with the
policy with different lead time values when the period length is fixed at T = 7 (λ = 5, h = 1, co = 5 and ce = 5).
Table 5. Comparison of three policies for T = 7, λ = 5, h = 1, co = 5 and ce = 5.
Online_appendix.pdf
Download PDF (696.7 KB)Data availability statement
The authors confirm that the data supporting the findings of this study are available within the article and its supplementary materials.