
Figures & data
Table 1. List of sets used in mathematical modeling.
Table 3. List of decision variables used in mathematical modeling.
Table 4. Experimental parameters varied; bolded values indicate base expansion model parameters.
Table 5. System overflow metrics comparing number of youth arriving with the base expansion model of 500 youth considering the average across 10 runs.
Figure 1. Illustrative example of sample RHY organizations that provide housing and support services to homeless youth, where X indicates the unavailable resources.
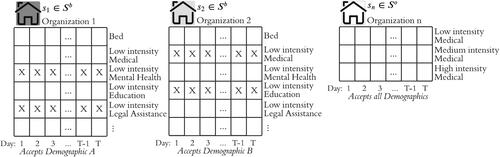
Table 2. List of parameters used in the mathematical modeling.
Figure 2. Examples of needs profiles for two youth who belong to two different demographics where shading indicates different demographics groups.
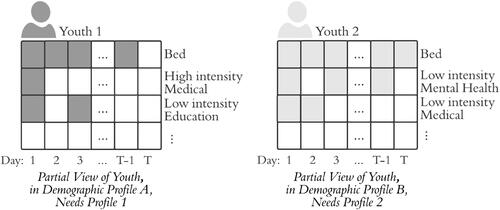
Figure 3. Youth are matched with RHY organization 1 and 2 respectively, considering the youth demographics and the accepted demographic at the RHY organizations. The services that are not provided in RHY organizations 1 or 2 are provided through
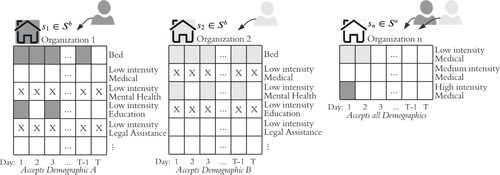
Table 6. Average system overflow metrics under base expansion model varying levels.
Figure 4. Average number of beds received by type, across 10 runs, eight organizations, and 6 months.
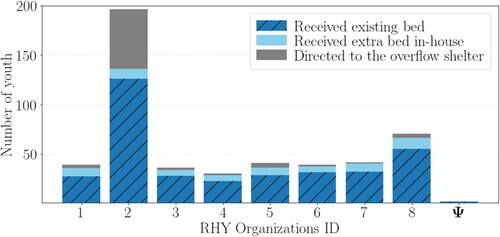
Figure 5. Per RHY organization, the average percentage increase in extra in-house resources and number of youth directed to overflow shelter compared with existing in-house capacity over 6 months.
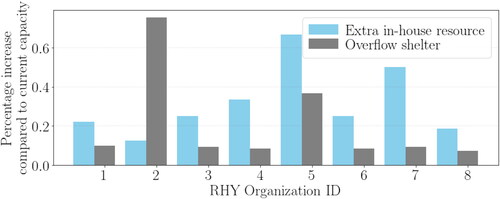
Figure 6. Average number of support services received, by type, over 6 months, across 10 runs.
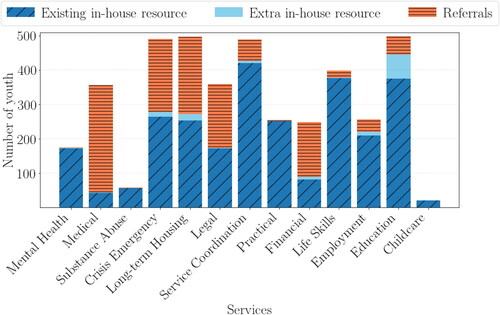
Figure 7. Average number of extra hours required, per RHY organization and support service, to fulfill demand fom youth, across 10 runs (note that extra in-house resources and referrals are combined).
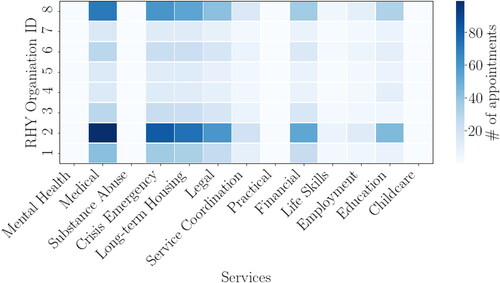
Figure 8. The effect of total number of youth in the system, on the daily trend in number of youth at the overflow shelter referred from Organization 2 over 6-months, with 90% confidence intervals over 10 runs.
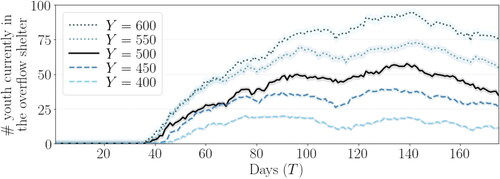
Figure 9. The effect of average length of stay, on the daily trend in number of youth at the overflow shelter referred from Organization 2 over 6 months, with 90% confidence intervals over 10 runs.
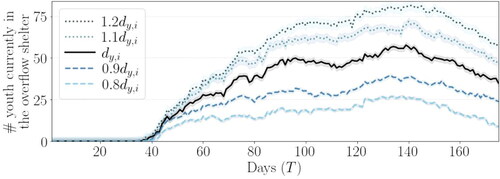
Figure 10. The effect of abandonment, on the daily trend in the number of youth at the overflow shelter referred from Organization 2 over 6 months, with 90% confidence intervals over 10 runs.
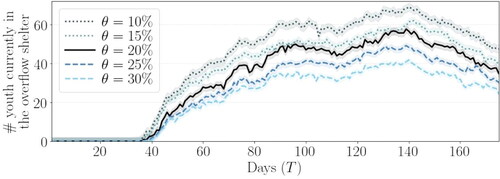
Table 7. Average system overflow metrics under base expansion model, varying abandonment levels.
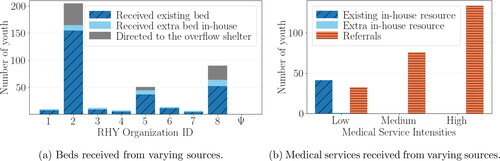
Figure 11. Average number of beds and different intensity of medical resources received by youth in organizations considering COVID-19, across 10 runs and 6 months.
Reproducibility Report
Download PDF (166.1 KB)Appendix-Improving_Access_to_Housing_for_RHY.pdf
Download PDF (114.2 KB)Data availability
The authors confirm that the aggregated data supporting the findings of this study are available within the article and its supplementary materials. As stated in the Institutional Review Board, due to the nature of this research, study participants (such as RHY organizations) did not agree for their data to be shared publicly; thus detailed, identifiable supporting data is not available.