Figures & data
Table 1. Probability distribution and the average on-scene time for different types of ambulances.
Table 2. Actual and simulated average response times (ART) in Slovakia.
Table 3. Theoretical average response times for the optimal network of ALS and BLS stations.
Table 4. Simulation results for Slovakia.
Table 5. Simulation results for urban areas.
Table 6. Simulation results for rural areas.
Figure 1. High and medium priority call handling.
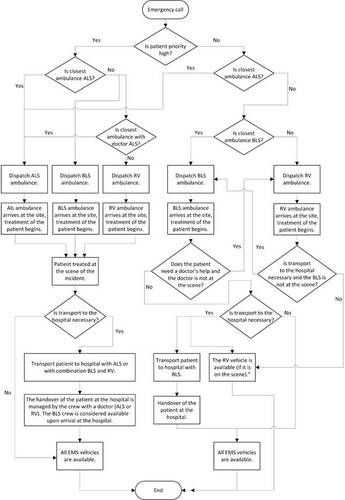
Figure 2. Low priority call handling.
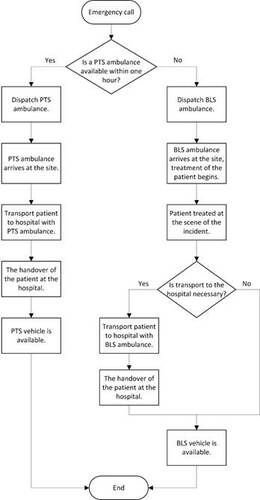
Figure 3. (a) The ratio of the number of trips on individual days to the daily average; (b) The ratio of the number of trips in individual months to the monthly average; (c) The average number of trips per hour.
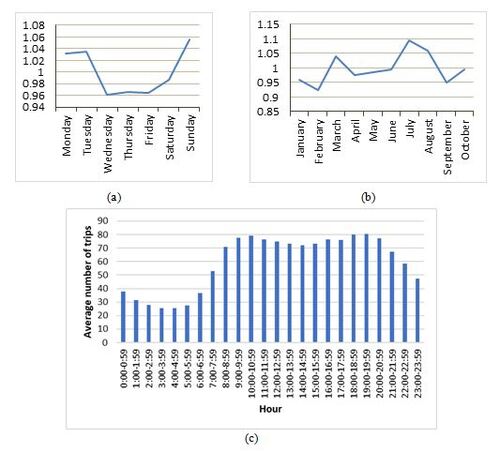
Figure 4. Proportion of high priority calls responded to within 8 min against the average response time. Error bars are 95% confidence intervals. (a) Slovakia; (b) urban areas; (c) rural areas.
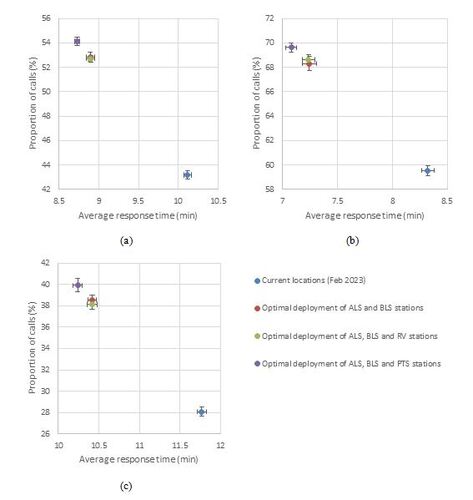
Figure 5. Number of calls responded to within a time threshold. (a) High priority; (b) Medium priority; (c) Low priority.
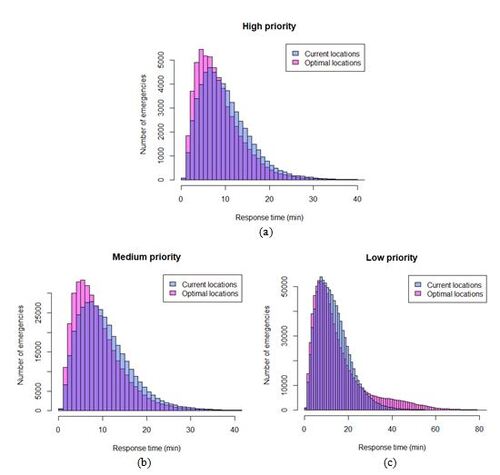
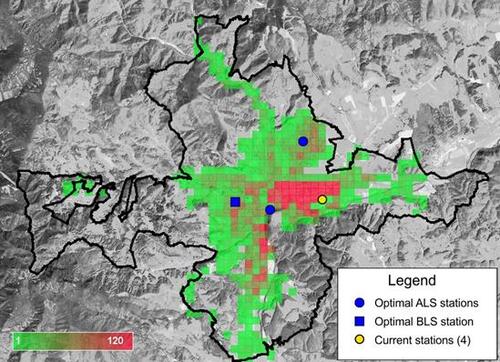
Figure 6. Distribution of demand from the simulation model over thirty months in the city of Banská Bystrica, showcasing both current and optimal positions of stations.