Figures & data
Table 1. Summary table of previous emotional rapid response inhibition studies in offending populations.
Table 2. Sample characteristics. This table shows sample characteristics per group. Prevalence rates and interquartile range are denoted within brackets.
Table 3. Commission Error Estimates are compared to a reference category (group: incarcerated individuals and emotion condition: Happy-Fear). Therefore, incarcerated individuals make more commission errors compared to NIC, and both groups make less commission errors in both Happy(go) -Neutral(No-Go) and Neutral(go) – Fear(No-Go) compared to the Happy(go) – Fear(No-Go) condition.
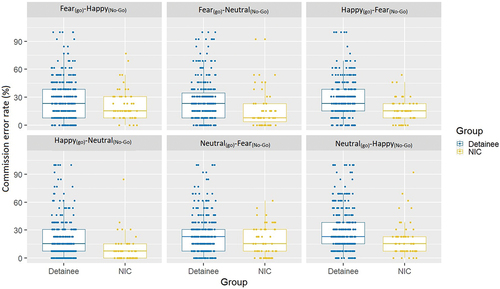
Figure 1. Commission error rate per emotion condition and group, uncorrected for age and education.