Figures & data
Table 1. Relative distance in each movement category during the first and second half of match play.
Table 2. Relative distance in each movement category across the four quarters of match play.
Figure 1. Relative distance (A) and the combined high and very high-speed running distance (B) across each quarter of match play. Data are presented as mean values with error bars representing SD and circles representing individual data points. HSR, high-speed running; VHSR, very high-speed running.
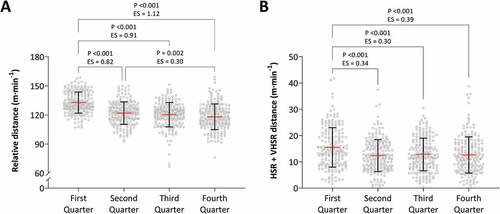
Figure 2. Effect size of the change in relative distance in each movement category from the (A) first to second, (B) first to third, (C) first to fourth, (D) second to third, (E) second to fourth and (F), third to fourth quarter of the AIC. Circles represent the ES, with the horizontal lines representing 95% confidence intervals. VLSM, very low-speed movement; LSR, low-speed running; MSR, moderate-speed running; HSR, high-speed running; VHSR, very high-speed running.