
Figures & data
Figure 1. A decision CRT used to identify predictors of dropout.
The CRT shows predictors and combination of predictors associated with the percentage (%) and number (n) of players that had continued within (No) and dropped out of (Yes) their team over the past year.
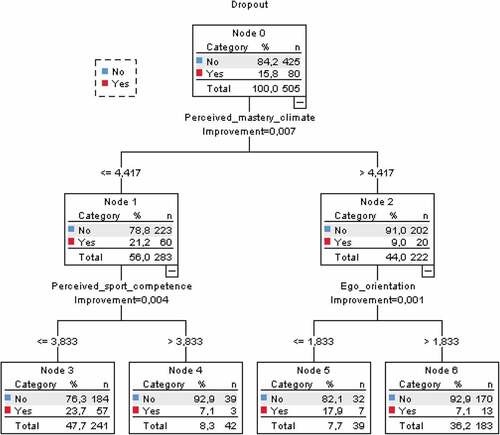
Table 1. Descriptive statistics and correlations of study variables.