
Figures & data
Figure 1. Flow of athlete participation through the study.
presents the total number of athletes recruited, and those that withdrew at various stages, with reasoning for withdrawal.
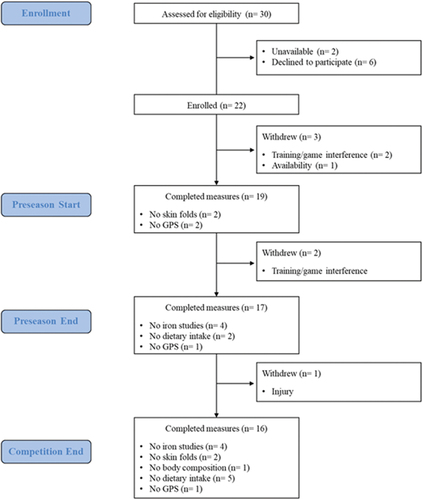
Table 1. Iron status, anthropometry, and GPS data of ALW athletes across seasons (mean ± SD).
Table 2. Dietary intake of AFLW athletes across seasons (mean ± SD).