
Figures & data
Figure 1. Carbamazepine concentrations and interventions. Initial serum carbamazepine concentration was 59 μg/mL and peaked at 120 μg/mL 16 hours later.
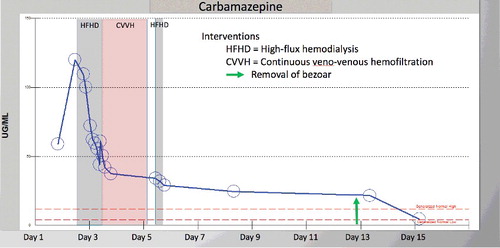
Figure 2. (a) Carbamazepine bezoar seen on esophagogastroduodenoscopy in situ measuring 5 cm in diameter, 9.9 g by weight on laboratory analysis. (b) The pharmacobezoar was fragmented and captured using a Roth Net. Three passes of the endoscope were required and an esophageal overtube was used to facilitate the complete retrieval of pharmacobezoar.
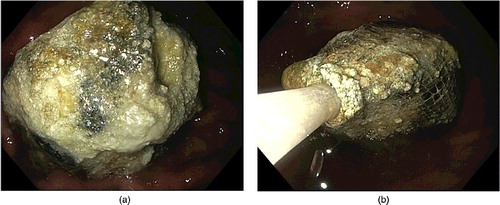
Table 1. Patient-specific factors associated with bezoar formation [Citation2,Citation3,Citation10–12].