Figures & data
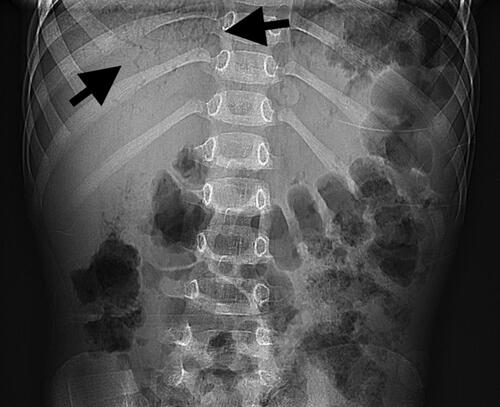
Figure 1. Abdominal radiograph. Upright radiograph demonstrates branching lucencies (arrows) in the right upper quadrant, compatible with portal venous gas.
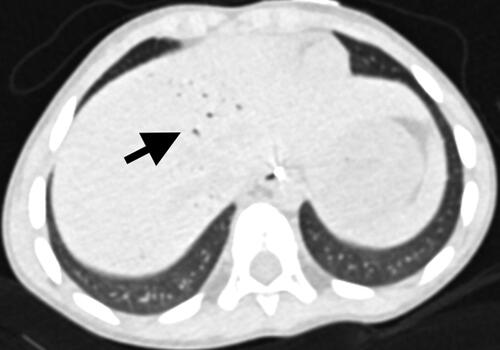
Figures 2. Abdominal computed tomography (CT) without contrast. Representative axial image confirms linear gas densities (arrow) within the hepatic dome.
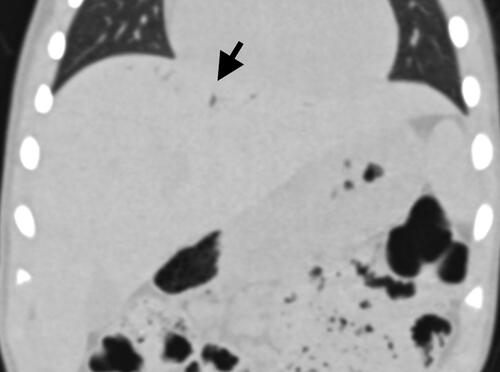
Figures 3. Abdominal computed tomography (CT) without contrast. Representative coronal lung window image confirms linear gas densities (arrow) within the hepatic dome.
Figures 4. Abdominal sonography. Representative sagittal image of the liver demonstrates echogenic foci with posterior acoustic shadowing in the peripheral hepatic dome, compatible with portal venous gas. On follow up the next day, this finding had resolved.
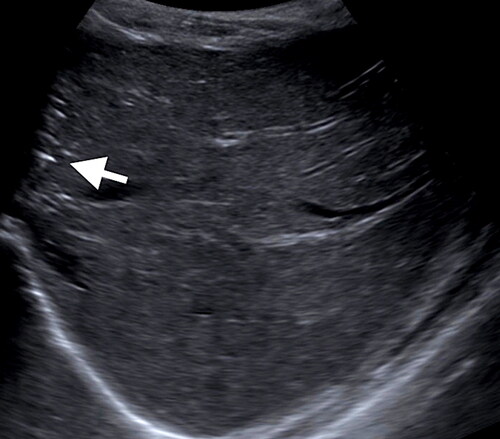
Figure 5. Abdominal sonography. Representative sagittal image of the liver demonstrates echogenic foci with posterior acoustic shadowing in the peripheral hepatic dome, compatible with portal venous gas. On follow up the next day, this finding had resolved.
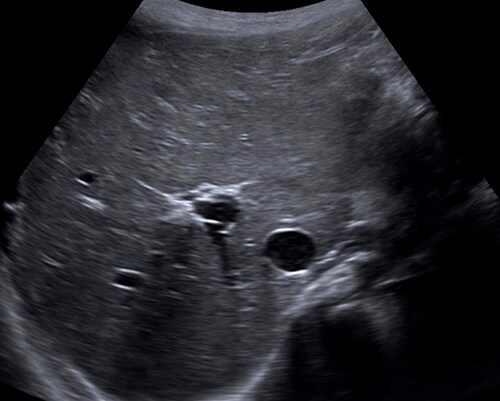
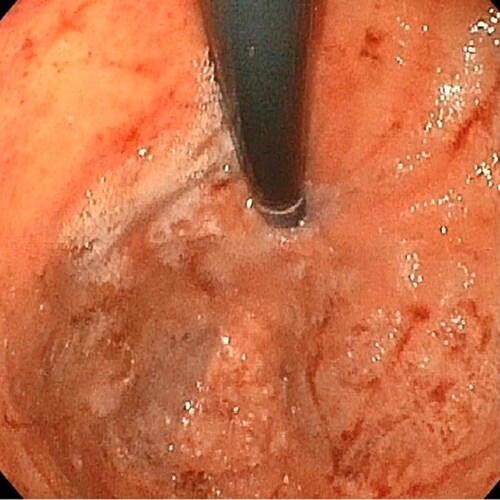
Figure 6. Endoscopy demonstrated superficial erosions, erythema, and edema of the gastric body after ingestion of ∼30ml of 35% hydrogen peroxide.
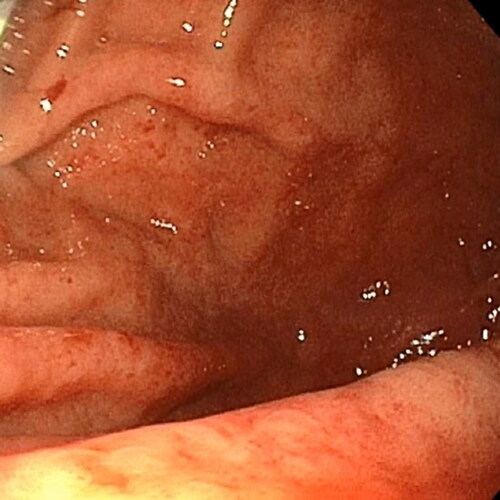
Figure 7. Endoscopy demonstrated superficial erosions, erythema, and edema of the cardia/fundus after ingestion of ∼30ml of 35% hydrogen peroxide.