Figures & data
Table 1. Demographics.
Table 2. Neuropathic and nonneuropathic symptom profiles.
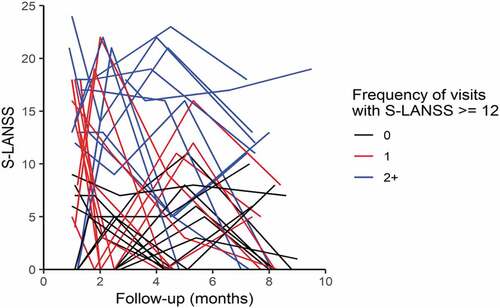
Figure 1. Distribution of S-LANSS scores over time. This graph represents each participant’s S-LANSS score over time. Participants with no neuropathic pain are shown in black. Participants indicating neuropathic pain on one visit only are in red. When neuropathic symptoms are transient, symptoms are more likely to be present during chemotherapy and decrease over time. Participants who reported neuropathic pain on multiple visits are shown in blue. Participants reporting neuropathic pain symptoms on multiple visits were likely to have persistent symptoms at the end of the trial.