Figures & data
Table 1. Effects of drugs on spinothalamic wide dynamic range neuronal responses in spinal nerve ligated rats
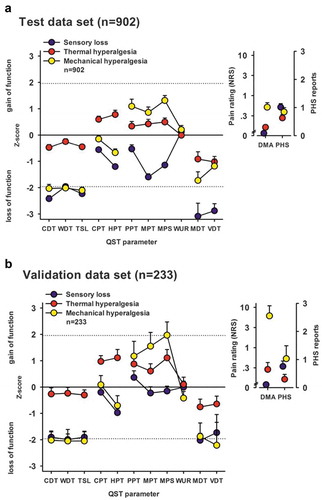
Figure 1. Sensory profiles of the three-cluster solution for test and replication data sets. Sensory profiles of the three clusters are presented as mean z scores ± 95% confidence interval for (A) the test data set (n = 902) and (B) the validation data set (n = 233). Note that z transformation eliminates differences due to test site, sex, and age. Positive z scores indicate positive sensory signs (hyperalgesia), whereas negative z values indicate negative sensory signs (hypoesthesia and hypoalgesia). Dashed lines: 95% confidence interval for healthy subjects (−1.96 < z < + 1.96). Note that if the mean of a cluster is within the shaded area, this does not imply that it does not differ from a healthy cohort. Values are significantly different from those of healthy subjects if the 95% confidence interval does not cross the zero line. Insets show numeric pain ratings for dynamic mechanical allodynia on a logarithmic scale (0–100) and frequency of paradoxical heat sensation (0–3). Blue symbols: Cluster 1 “sensory loss” (42% in A and 53% in B). Red symbols: Cluster 2 “thermal hyperalgesia” (33% in A and B). Yellow symbols: Cluster 3 “mechanical hyperalgesia” (24% in A and 14% in B). CDT = cold detection threshold; WDT = warm detection threshold; TSL = thermal sensory limen; CPT = cold pain threshold; HPT = heat pain threshold; PPT = pressure pain threshold; MPT = mechanical pain threshold; MPS = mechanical pain sensitivity; WUR = windup ratio; MDT = mechanical detection threshold; VDT = vibration detection threshold; NRS = Numerical Rating Scale; DMA = dynamic mechanical allodynia; PHS = paradoxical heat sensation. Reproduced with permission from Baron et al.Citation5 (under a Creative Commons license)